 Email
Email Print
Print


Unmanned Underwater Vehicle Market - Forecast(2025 - 2031)
Unmanned Underwater Vehicle Market Overview:
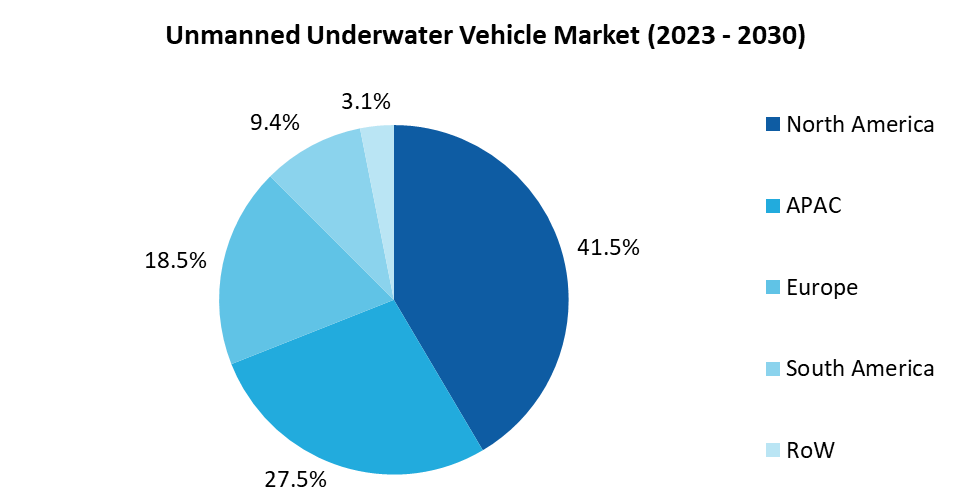
The Unmanned Underwater Vehicle Market size is estimated to reach $9.7 billion by 2030, growing at a CAGR of 10.6% during the forecast period 2024-2030. The market for unmanned underwater vehicles (UUVs) is expanding significantly as a result of global defense budget increases, growing maritime exploration activities, and robotics breakthroughs. UUVs are used for a variety of purposes, including as scientific research, military operations, offshore oil and gas extraction, and environmental monitoring.
They are typically divided into two categories: autonomous underwater vehicles (AUVs) and remotely operated vehicles (ROVs). The market for UUVs is dominated by the defense industry, which uses these vehicles for anti-submarine warfare, surveillance, reconnaissance, and mine countermeasures. To improve their naval capabilities, governments all around the world are making significant investments in UUV technologies. For improved underwater operations, for example, the US Navy and other international forces are incorporating cutting-edge UUVs. The demand for UUVs in the business sector is largely driven by the oil and gas sector. These vehicles are employed for seabed mapping, offshore drilling infrastructure maintenance, and underwater pipeline inspections. UUV adoption is also anticipated to increase as a result of the growing emphasis on renewable energy sources like offshore wind farms. Applications in science and the environment are also expanding rapidly in the market. Because UUVs allow researchers to explore unexplored areas with little human interaction, they are being used more and more for oceanographic research, marine biodiversity studies, and underwater archeology. Due to substantial defense spending and technological improvements, North America has a major geographic share of the UUV market.
Market Snapshot:
Unmanned Underwater Vehicle Market - Report Coverage:
The “Unmanned Underwater Vehicle Market Report - Forecast (2024-2030)” by IndustryARC, covers an in-depth analysis of the following segments in the Unmanned Underwater Vehicle Market
| Attribute | Segment |
|---|---|
|
By Type |
|
|
By Operating Depth |
|
|
By Subsystem |
|
|
By Application |
|
|
By Geography |
|
COVID-19 / Ukraine Crisis - Impact Analysis:
The COVID-19 pandemic significantly disrupted the Unmanned Underwater Vehicle Market, causing lockdowns and supply chain interruptions that led to reduced production and delayed distribution of essential components. However, the market is rebounding as industries such as defense, research, and offshore energy increasingly adopt UUVs for critical applications like surveillance, exploration, and data collection. The growing demand for advanced technologies, including autonomous navigation systems and energy-efficient power sources, is driving recovery and innovation within the UUV market.
The Ukraine crisis has further impacted the Unmanned Underwater Vehicle Market by disrupting global supply chains. The conflict has resulted in shortages of critical raw materials, such as rare earth metals used in sensors and propulsion systems, and increased transportation costs, leading to higher prices and production delays. To mitigate these challenges, companies are exploring alternative material sources and enhancing supply chain resilience through supplier diversification and localized manufacturing. These strategies aim to stabilize the market and ensure the availability of high-quality components, enabling continued innovation and deployment of UUVs despite geopolitical uncertainties.
Key Takeaways:
• Fastest Growth of APAC Region
Geographically, in the Unmanned Underwater Vehicle Market share, APAC is analyzed to grow with the highest CAGR of 12.5% during the forecast period 2024-2030. The market for unmanned underwater vehicles is anticipated to develop at the quickest rate in the APAC region because of rising investments in undersea exploration, defense modernization, and marine security. As a result of growing geopolitical tensions and territorial conflicts in areas like the South China Sea, nations like China, Japan, India, and South Korea are severely increasing their underwater defensive capabilities. The region's largest investment in UUV technologies for surveillance and reconnaissance missions is coming from China in particular. Its proactive approach to the development of cutting-edge autonomous undersea vehicles is getting neighboring nations to do the same. For resource exploration, environmental monitoring, and undersea research, South Korea and Japan are concentrating on UUVs. India has also expressed interest in incorporating UUVs into its defense policy to improve its naval capabilities.
• Hybrid Vehicles Segment to Register the Fastest Growth
In the Unmanned Underwater Vehicle Market analysis, the Hybrid Vehicles segment is estimated to grow with the highest CAGR of 22.1% during the forecast period. In the UUV industry, hybrid unmanned underwater vehicles which combine the capabilities of autonomous underwater vehicles (AUVs) and remotely operated vehicles (ROVs) are expanding at the quickest rate. Because they may be operated remotely for some jobs and autonomously for longer missions, these vehicles offer operational flexibility. Because their flexibility to transition between autonomous and remote operations improves mission success rates, hybrid UUVs are especially useful in deep-sea exploration, oil and gas pipeline inspection, and underwater archaeology. Hybrid UUVs are being used by defense industries around the world for a variety of multipurpose tasks, such as search and rescue operations, mine detection, and underwater surveillance. Hybrid cars are now more dependable and efficient because of technological developments in sensor integration, communication systems, and battery life.
• Autonomous Unmanned Vehicles (AUV) is Leading the Market
According to the Unmanned Underwater Vehicle Market Forecast, Autonomous Unmanned Vehicles (AUV) held the largest market share of 62.1% in 2023. The market for unmanned unmanned vehicles (UUVs) is dominated by autonomous vehicles (AUVs) because of their sophisticated capabilities and extensive industry use. Because AUVs don't require human interaction, they are perfect for missions like military reconnaissance, environmental monitoring, and deep-sea research. The major end-user of AUVs is the defense industry, which employs them for anti-submarine warfare, intelligence collection, and underwater surveillance. Advanced technologies like artificial intelligence and machine learning are being developed for autonomous navigation and complex mission performance on AUVs. AUVs are now essential tools for national security because of their capacity to gather vital data in dangerous or inaccessible underwater regions. AUVs are widely utilized in the oil and gas industry for resource exploration, pipeline inspections, and seabed mapping in addition to defense.
• High Initial and Ongoing Expenses is a Challenge
The high initial investment and continuing operating costs of Unmanned Underwater Vehicles (UUVs) provide major obstacles for the business. Advanced sensors, communication systems, and propulsion mechanisms are among the cutting-edge technologies needed to develop UUVs, which raises manufacturing costs. Additionally, incorporating autonomous capabilities and artificial intelligence raises production costs and complexity. Another big worry is operational costs. For UUVs to operate at their best, especially in challenging underwater conditions, regular maintenance, software upgrades, and repairs are necessary. Costs are further increased by the fact that the deployment of UUVs frequently calls for specialized support infrastructure, like surface ships or submarines. These cost obstacles may make it more difficult for smaller businesses and developing nations to implement UUV technology.
• Demand for Deep-Sea Exploration is Rising
The market for UUVs is expanding due to the need for deep-sea exploration. The demand for cutting-edge technologies that can function at extremely deep depths is rising since more than 80% of the world's seas remain uncharted. With their autonomous capabilities that allow them to negotiate challenging underwater circumstances and gather useful data, UUVs are in a unique position to address this demand. Environmental monitoring, underwater archeology, and resource mapping are some of the deep-sea exploration uses for UUVs. For instance, UUVs are being used more and more by the mining sector to find and assess deep-sea mineral reserves. In a similar vein, scientists use these vehicles to investigate marine biodiversity and comprehend how climate change affects undersea ecosystems. It is anticipated that the UUV market will continue to develop as interest in sustainable resource exploration increases.
• Increasing use in Defense and Military Applications.
UUVs are becoming more and more popular in military and defense applications due to their adaptability and capacity to function in hazardous conditions. Numerous tasks, such as mine detection, surveillance, reconnaissance, and anti-submarine warfare, are carried out by UUVs. Because of their capacity to function independently and covertly in underwater environments, they are an essential component of contemporary navies. The demand for UUVs has increased recently due to geopolitical tensions and worries about maritime security. Countries are bolstering their naval capabilities by investing in cutting-edge underwater technologies. For instance, without endangering human life, UUVs with sensors and cameras may identify dangers, obtain intelligence, and destroy mines. Additionally, the combination of machine learning and artificial intelligence is improving UUVs' operational capabilities.
Key Market Players:
Product/Service launches, approvals, patents and events, acquisitions, partnerships, and collaborations are key strategies adopted by players in the Unmanned Underwater Vehicle Market The top 10 companies in this industry are listed below:
1. SAAB AB
2. Oceaneering International, Inc.
3. Deep Ocean Engineering
4. General Dynamics Mission Systems, Inc.
5. ECA GROUP
6. Fugro
7. Teledyne Technologies Inc.
8. L3 Harris Technologies Inc.
9. Lockheed Martin Corporation
10. Atlas Elektronik GmbH
Scope of the Report:
| Report Metric | Details |
|---|---|
|
Base Year Considered |
2023 |
|
Forecast Period |
2024–2030 |
|
CAGR |
10.6% |
|
Market Size in 2030 |
$15.4 billion |
|
Segments Covered |
By Type, By Operating Depth, By Subsystem, By Application. and Geography. |
|
Geographies Covered |
North America, South America, Europe, APAC, RoW. |
|
Key Market Players |
|
For more Aerospace and Defense Market related reports, please click here
List of Tables
Table1 Unmanned Underwater Vehicles (UUV) Market Overview 2023-2030
Table2 Unmanned Underwater Vehicles (UUV) Market Leader Analysis 2023-2024 (US$)
Table3 Unmanned Underwater Vehicles (UUV) MarketProduct Analysis 2023-2024 (US$)
Table4 Unmanned Underwater Vehicles (UUV) MarketEnd User Analysis 2023-2024 (US$)
Table5 Unmanned Underwater Vehicles (UUV) MarketPatent Analysis 2021-2023* (US$)
Table6 Unmanned Underwater Vehicles (UUV) MarketFinancial Analysis 2023-2024 (US$)
Table7 Unmanned Underwater Vehicles (UUV) Market Driver Analysis 2023-2024 (US$)
Table8 Unmanned Underwater Vehicles (UUV) MarketChallenges Analysis 2023-2024 (US$)
Table9 Unmanned Underwater Vehicles (UUV) MarketConstraint Analysis 2023-2024 (US$)
Table10 Unmanned Underwater Vehicles (UUV) Market Supplier Bargaining Power Analysis 2023-2024 (US$)
Table11 Unmanned Underwater Vehicles (UUV) Market Buyer Bargaining Power Analysis 2023-2024 (US$)
Table12 Unmanned Underwater Vehicles (UUV) Market Threat of Substitutes Analysis 2023-2024 (US$)
Table13 Unmanned Underwater Vehicles (UUV) Market Threat of New Entrants Analysis 2023-2024 (US$)
Table14 Unmanned Underwater Vehicles (UUV) Market Degree of Competition Analysis 2023-2024 (US$)
Table15 Unmanned Underwater Vehicles (UUV) MarketValue Chain Analysis 2023-2024 (US$)
Table16 Unmanned Underwater Vehicles (UUV) MarketPricing Analysis 2023-2030 (US$)
Table17 Unmanned Underwater Vehicles (UUV) MarketOpportunities Analysis 2023-2030 (US$)
Table18 Unmanned Underwater Vehicles (UUV) MarketProduct Life Cycle Analysis 2023-2030 (US$)
Table19 Unmanned Underwater Vehicles (UUV) MarketSupplier Analysis 2023-2024 (US$)
Table20 Unmanned Underwater Vehicles (UUV) MarketDistributor Analysis 2023-2024 (US$)
Table21 Unmanned Underwater Vehicles (UUV) Market Trend Analysis 2023-2024 (US$)
Table22 Unmanned Underwater Vehicles (UUV) Market Size 2023 (US$)
Table23 Unmanned Underwater Vehicles (UUV) Market Forecast Analysis 2023-2030 (US$)
Table24 Unmanned Underwater Vehicles (UUV) Market Sales Forecast Analysis 2023-2030 (Units)
Table25 Unmanned Underwater Vehicles (UUV) Market, Revenue & Volume,By Type, 2023-2030 ($)
Table26 Unmanned Underwater Vehicles (UUV) MarketBy Type, Revenue & Volume,By Autonomous Unmanned Vehicles (AUV), 2023-2030 ($)
Table27 Unmanned Underwater Vehicles (UUV) MarketBy Type, Revenue & Volume,By Remotely Operated Vehicles (ROV), 2023-2030 ($)
Table28 Unmanned Underwater Vehicles (UUV) MarketBy Type, Revenue & Volume,By Hybrid Vehicles, 2023-2030 ($)
Table29 Unmanned Underwater Vehicles (UUV) Market, Revenue & Volume,By Application, 2023-2030 ($)
Table30 Unmanned Underwater Vehicles (UUV) MarketBy Application, Revenue & Volume,By Defence and Government, 2023-2030 ($)
Table31 Unmanned Underwater Vehicles (UUV) MarketBy Application, Revenue & Volume,By Academic and Scientific Research, 2023-2030 ($)
Table32 Unmanned Underwater Vehicles (UUV) MarketBy Application, Revenue & Volume,By Commercial Exploration, 2023-2030 ($)
Table33 Unmanned Underwater Vehicles (UUV) MarketBy Application, Revenue & Volume,By Retrieval and Delivery Systems, 2023-2030 ($)
Table34 North America Unmanned Underwater Vehicles (UUV) Market, Revenue & Volume,By Type, 2023-2030 ($)
Table35 North America Unmanned Underwater Vehicles (UUV) Market, Revenue & Volume,By Product, 2023-2030 ($)
Table36 North America Unmanned Underwater Vehicles (UUV) Market, Revenue & Volume,By Technology, 2023-2030 ($)
Table37 North America Unmanned Underwater Vehicles (UUV) Market, Revenue & Volume,By Application, 2023-2030 ($)
Table38 North America Unmanned Underwater Vehicles (UUV) Market, Revenue & Volume,By End Use, 2023-2030 ($)
Table39 South america Unmanned Underwater Vehicles (UUV) Market, Revenue & Volume,By Type, 2023-2030 ($)
Table40 South america Unmanned Underwater Vehicles (UUV) Market, Revenue & Volume,By Product, 2023-2030 ($)
Table41 South america Unmanned Underwater Vehicles (UUV) Market, Revenue & Volume,By Technology, 2023-2030 ($)
Table42 South america Unmanned Underwater Vehicles (UUV) Market, Revenue & Volume,By Application, 2023-2030 ($)
Table43 South america Unmanned Underwater Vehicles (UUV) Market, Revenue & Volume,By End Use, 2023-2030 ($)
Table44 Europe Unmanned Underwater Vehicles (UUV) Market, Revenue & Volume,By Type, 2023-2030 ($)
Table45 Europe Unmanned Underwater Vehicles (UUV) Market, Revenue & Volume,By Product, 2023-2030 ($)
Table46 Europe Unmanned Underwater Vehicles (UUV) Market, Revenue & Volume,By Technology, 2023-2030 ($)
Table47 Europe Unmanned Underwater Vehicles (UUV) Market, Revenue & Volume,By Application, 2023-2030 ($)
Table48 Europe Unmanned Underwater Vehicles (UUV) Market, Revenue & Volume,By End Use, 2023-2030 ($)
Table49 APAC Unmanned Underwater Vehicles (UUV) Market, Revenue & Volume,By Type, 2023-2030 ($)
Table50 APAC Unmanned Underwater Vehicles (UUV) Market, Revenue & Volume,By Product, 2023-2030 ($)
Table51 APAC Unmanned Underwater Vehicles (UUV) Market, Revenue & Volume,By Technology, 2023-2030 ($)
Table52 APAC Unmanned Underwater Vehicles (UUV) Market, Revenue & Volume,By Application, 2023-2030 ($)
Table53 APAC Unmanned Underwater Vehicles (UUV) Market, Revenue & Volume,By End Use, 2023-2030 ($)
Table54 Middle East & Africa Unmanned Underwater Vehicles (UUV) Market, Revenue & Volume,By Type, 2023-2030 ($)
Table55 Middle East & Africa Unmanned Underwater Vehicles (UUV) Market, Revenue & Volume,By Product, 2023-2030 ($)
Table56 Middle East & Africa Unmanned Underwater Vehicles (UUV) Market, Revenue & Volume,By Technology, 2023-2030 ($)
Table57 Middle East & Africa Unmanned Underwater Vehicles (UUV) Market , Revenue & Volume,By Application, 2023-2030 ($)
Table58 Middle East & Africa Unmanned Underwater Vehicles (UUV) Market, Revenue & Volume,By End Use, 2023-2030 ($)
Table59 Russia Unmanned Underwater Vehicles (UUV) Market, Revenue & Volume,By Type, 2023-2030 ($)
Table60 Russia Unmanned Underwater Vehicles (UUV) Market, Revenue & Volume,By Product, 2023-2030 ($)
Table61 Russia Unmanned Underwater Vehicles (UUV) Market, Revenue & Volume,By Technology, 2023-2030 ($)
Table62 Russia Unmanned Underwater Vehicles (UUV) Market, Revenue & Volume,By Application, 2023-2030 ($)
Table63 Russia Unmanned Underwater Vehicles (UUV) Market, Revenue & Volume,By End Use, 2023-2030 ($)
Table64 Israel Unmanned Underwater Vehicles (UUV) Market, Revenue & Volume,By Type, 2023-2030 ($)
Table65 Israel Unmanned Underwater Vehicles (UUV) Market, Revenue & Volume,By Product, 2023-2030 ($)
Table66 Israel Unmanned Underwater Vehicles (UUV) Market, Revenue & Volume,By Technology, 2023-2030 ($)
Table67 Israel Unmanned Underwater Vehicles (UUV) Market, Revenue & Volume,By Application, 2023-2030 ($)
Table68 Israel Unmanned Underwater Vehicles (UUV) Market, Revenue & Volume,By End Use, 2023-2030 ($)
Table69 Top Companies 2023 (US$)Unmanned Underwater Vehicles (UUV) Market, Revenue & Volume,,
Table70 Product Launch 2023-2024Unmanned Underwater Vehicles (UUV) Market, Revenue & Volume,,
Table71 Mergers & Acquistions 2023-2024Unmanned Underwater Vehicles (UUV) Market, Revenue & Volume,,
List of Figures
Figure 1 Overview of Unmanned Underwater Vehicles (UUV) Market 2023-2030
Figure 2 Market Share Analysis for Unmanned Underwater Vehicles (UUV) Market 2023 (US$)
Figure 3 Product Comparison in Unmanned Underwater Vehicles (UUV) Market 2023-2024 (US$)
Figure 4 End User Profile for Unmanned Underwater Vehicles (UUV) Market 2023-2024 (US$)
Figure 5 Patent Application and Grant in Unmanned Underwater Vehicles (UUV) Market 2021-2023* (US$)
Figure 6 Top 5 Companies Financial Analysis in Unmanned Underwater Vehicles (UUV) Market 2023-2024 (US$)
Figure 7 Market Entry Strategy in Unmanned Underwater Vehicles (UUV) Market 2023-2024
Figure 8 Ecosystem Analysis in Unmanned Underwater Vehicles (UUV) Market2023
Figure 9 Average Selling Price in Unmanned Underwater Vehicles (UUV) Market 2023-2030
Figure 10 Top Opportunites in Unmanned Underwater Vehicles (UUV) Market 2023-2024
Figure 11 Market Life Cycle Analysis in Unmanned Underwater Vehicles (UUV) Market
Figure 12 GlobalBy TypeUnmanned Underwater Vehicles (UUV) Market Revenue, 2023-2030 ($)
Figure 13 GlobalBy ApplicationUnmanned Underwater Vehicles (UUV) Market Revenue, 2023-2030 ($)
Figure 14 Global Unmanned Underwater Vehicles (UUV) Market - By Geography
Figure 15 Global Unmanned Underwater Vehicles (UUV) Market Value & Volume, By Geography, 2023-2030 ($)
Figure 16 Global Unmanned Underwater Vehicles (UUV) Market CAGR, By Geography, 2023-2030 (%)
Figure 17 North America Unmanned Underwater Vehicles (UUV) Market Value & Volume, 2023-2030 ($)
Figure 18 US Unmanned Underwater Vehicles (UUV) Market Value & Volume, 2023-2030 ($)
Figure 19 US GDP and Population, 2023-2024 ($)
Figure 20 US GDP – Composition of 2023, By Sector of Origin
Figure 21 US Export and Import Value & Volume, 2023-2024 ($)
Figure 22 Canada Unmanned Underwater Vehicles (UUV) Market Value & Volume, 2023-2030 ($)
Figure 23 Canada GDP and Population, 2023-2024 ($)
Figure 24 Canada GDP – Composition of 2023, By Sector of Origin
Figure 25 Canada Export and Import Value & Volume, 2023-2024 ($)
Figure 26 Mexico Unmanned Underwater Vehicles (UUV) Market Value & Volume, 2023-2030 ($)
Figure 27 Mexico GDP and Population, 2023-2024 ($)
Figure 28 Mexico GDP – Composition of 2023, By Sector of Origin
Figure 29 Mexico Export and Import Value & Volume, 2023-2024 ($)
Figure 30 South America Unmanned Underwater Vehicles (UUV) MarketSouth America 3D Printing Market Value & Volume, 2023-2030 ($)
Figure 31 Brazil Unmanned Underwater Vehicles (UUV) Market Value & Volume, 2023-2030 ($)
Figure 32 Brazil GDP and Population, 2023-2024 ($)
Figure 33 Brazil GDP – Composition of 2023, By Sector of Origin
Figure 34 Brazil Export and Import Value & Volume, 2023-2024 ($)
Figure 35 Venezuela Unmanned Underwater Vehicles (UUV) Market Value & Volume, 2023-2030 ($)
Figure 36 Venezuela GDP and Population, 2023-2024 ($)
Figure 37 Venezuela GDP – Composition of 2023, By Sector of Origin
Figure 38 Venezuela Export and Import Value & Volume, 2023-2024 ($)
Figure 39 Argentina Unmanned Underwater Vehicles (UUV) Market Value & Volume, 2023-2030 ($)
Figure 40 Argentina GDP and Population, 2023-2024 ($)
Figure 41 Argentina GDP – Composition of 2023, By Sector of Origin
Figure 42 Argentina Export and Import Value & Volume, 2023-2024 ($)
Figure 43 Ecuador Unmanned Underwater Vehicles (UUV) Market Value & Volume, 2023-2030 ($)
Figure 44 Ecuador GDP and Population, 2023-2024 ($)
Figure 45 Ecuador GDP – Composition of 2023, By Sector of Origin
Figure 46 Ecuador Export and Import Value & Volume, 2023-2024 ($)
Figure 47 Peru Unmanned Underwater Vehicles (UUV) Market Value & Volume, 2023-2030 ($)
Figure 48 Peru GDP and Population, 2023-2024 ($)
Figure 49 Peru GDP – Composition of 2023, By Sector of Origin
Figure 50 Peru Export and Import Value & Volume, 2023-2024 ($)
Figure 51 Colombia Unmanned Underwater Vehicles (UUV) Market Value & Volume, 2023-2030 ($)
Figure 52 Colombia GDP and Population, 2023-2024 ($)
Figure 53 Colombia GDP – Composition of 2023, By Sector of Origin
Figure 54 Colombia Export and Import Value & Volume, 2023-2024 ($)
Figure 55 Costa Rica Unmanned Underwater Vehicles (UUV) MarketCosta Rica 3D Printing Market Value & Volume, 2023-2030 ($)
Figure 56 Costa Rica GDP and Population, 2023-2024 ($)
Figure 57 Costa Rica GDP – Composition of 2023, By Sector of Origin
Figure 58 Costa Rica Export and Import Value & Volume, 2023-2024 ($)
Figure 59 Europe Unmanned Underwater Vehicles (UUV) Market Value & Volume, 2023-2030 ($)
Figure 60 U.K Unmanned Underwater Vehicles (UUV) Market Value & Volume, 2023-2030 ($)
Figure 61 U.K GDP and Population, 2023-2024 ($)
Figure 62 U.K GDP – Composition of 2023, By Sector of Origin
Figure 63 U.K Export and Import Value & Volume, 2023-2024 ($)
Figure 64 Germany Unmanned Underwater Vehicles (UUV) Market Value & Volume, 2023-2030 ($)
Figure 65 Germany GDP and Population, 2023-2024 ($)
Figure 66 Germany GDP – Composition of 2023, By Sector of Origin
Figure 67 Germany Export and Import Value & Volume, 2023-2024 ($)
Figure 68 Italy Unmanned Underwater Vehicles (UUV) Market Value & Volume, 2023-2030 ($)
Figure 69 Italy GDP and Population, 2023-2024 ($)
Figure 70 Italy GDP – Composition of 2023, By Sector of Origin
Figure 71 Italy Export and Import Value & Volume, 2023-2024 ($)
Figure 72 France Unmanned Underwater Vehicles (UUV) Market Value & Volume, 2023-2030 ($)
Figure 73 France GDP and Population, 2023-2024 ($)
Figure 74 France GDP – Composition of 2023, By Sector of Origin
Figure 75 France Export and Import Value & Volume, 2023-2024 ($)
Figure 76 Netherlands Unmanned Underwater Vehicles (UUV) Market Value & Volume, 2023-2030 ($)
Figure 77 Netherlands GDP and Population, 2023-2024 ($)
Figure 78 Netherlands GDP – Composition of 2023, By Sector of Origin
Figure 79 Netherlands Export and Import Value & Volume, 2023-2024 ($)
Figure 80 Belgium Unmanned Underwater Vehicles (UUV) Market Value & Volume, 2023-2030 ($)
Figure 81 Belgium GDP and Population, 2023-2024 ($)
Figure 82 Belgium GDP – Composition of 2023, By Sector of Origin
Figure 83 Belgium Export and Import Value & Volume, 2023-2024 ($)
Figure 84 Spain Unmanned Underwater Vehicles (UUV) Market Value & Volume, 2023-2030 ($)
Figure 85 Spain GDP and Population, 2023-2024 ($)
Figure 86 Spain GDP – Composition of 2023, By Sector of Origin
Figure 87 Spain Export and Import Value & Volume, 2023-2024 ($)
Figure 88 Denmark Unmanned Underwater Vehicles (UUV) Market Value & Volume, 2023-2030 ($)
Figure 89 Denmark GDP and Population, 2023-2024 ($)
Figure 90 Denmark GDP – Composition of 2023, By Sector of Origin
Figure 91 Denmark Export and Import Value & Volume, 2023-2024 ($)
Figure 92 APAC Unmanned Underwater Vehicles (UUV) Market Value & Volume, 2023-2030 ($)
Figure 93 China Unmanned Underwater Vehicles (UUV) MarketValue & Volume, 2023-2030
Figure 94 China GDP and Population, 2023-2024 ($)
Figure 95 China GDP – Composition of 2023, By Sector of Origin
Figure 96 China Export and Import Value & Volume, 2023-2024 ($)Unmanned Underwater Vehicles (UUV) MarketChina Export and Import Value & Volume, 2023-2024 ($)
Figure 97 Australia Unmanned Underwater Vehicles (UUV) Market Value & Volume, 2023-2030 ($)
Figure 98 Australia GDP and Population, 2023-2024 ($)
Figure 99 Australia GDP – Composition of 2023, By Sector of Origin
Figure 100 Australia Export and Import Value & Volume, 2023-2024 ($)
Figure 101 South Korea Unmanned Underwater Vehicles (UUV) Market Value & Volume, 2023-2030 ($)
Figure 102 South Korea GDP and Population, 2023-2024 ($)
Figure 103 South Korea GDP – Composition of 2023, By Sector of Origin
Figure 104 South Korea Export and Import Value & Volume, 2023-2024 ($)
Figure 105 India Unmanned Underwater Vehicles (UUV) Market Value & Volume, 2023-2030 ($)
Figure 106 India GDP and Population, 2023-2024 ($)
Figure 107 India GDP – Composition of 2023, By Sector of Origin
Figure 108 India Export and Import Value & Volume, 2023-2024 ($)
Figure 109 Taiwan Unmanned Underwater Vehicles (UUV) MarketTaiwan 3D Printing Market Value & Volume, 2023-2030 ($)
Figure 110 Taiwan GDP and Population, 2023-2024 ($)
Figure 111 Taiwan GDP – Composition of 2023, By Sector of Origin
Figure 112 Taiwan Export and Import Value & Volume, 2023-2024 ($)
Figure 113 Malaysia Unmanned Underwater Vehicles (UUV) MarketMalaysia 3D Printing Market Value & Volume, 2023-2030 ($)
Figure 114 Malaysia GDP and Population, 2023-2024 ($)
Figure 115 Malaysia GDP – Composition of 2023, By Sector of Origin
Figure 116 Malaysia Export and Import Value & Volume, 2023-2024 ($)
Figure 117 Hong Kong Unmanned Underwater Vehicles (UUV) MarketHong Kong 3D Printing Market Value & Volume, 2023-2030 ($)
Figure 118 Hong Kong GDP and Population, 2023-2024 ($)
Figure 119 Hong Kong GDP – Composition of 2023, By Sector of Origin
Figure 120 Hong Kong Export and Import Value & Volume, 2023-2024 ($)
Figure 121 Middle East & Africa Unmanned Underwater Vehicles (UUV) MarketMiddle East & Africa 3D Printing Market Value & Volume, 2023-2030 ($)
Figure 122 Russia Unmanned Underwater Vehicles (UUV) MarketRussia 3D Printing Market Value & Volume, 2023-2030 ($)
Figure 123 Russia GDP and Population, 2023-2024 ($)
Figure 124 Russia GDP – Composition of 2023, By Sector of Origin
Figure 125 Russia Export and Import Value & Volume, 2023-2024 ($)
Figure 126 Israel Unmanned Underwater Vehicles (UUV) Market Value & Volume, 2023-2030 ($)
Figure 127 Israel GDP and Population, 2023-2024 ($)
Figure 128 Israel GDP – Composition of 2023, By Sector of Origin
Figure 129 Israel Export and Import Value & Volume, 2023-2024 ($)
Figure 130 Entropy Share, By Strategies, 2023-2024* (%)Unmanned Underwater Vehicles (UUV) Market
Figure 131 Developments, 2023-2024*Unmanned Underwater Vehicles (UUV) Market
Figure 132 Company 1 Unmanned Underwater Vehicles (UUV) Market Net Revenue, By Years, 2023-2024* ($)
Figure 133 Company 1 Unmanned Underwater Vehicles (UUV) Market Net Revenue Share, By Business segments, 2023 (%)
Figure 134 Company 1 Unmanned Underwater Vehicles (UUV) Market Net Sales Share, By Geography, 2023 (%)
Figure 135 Company 2 Unmanned Underwater Vehicles (UUV) Market Net Revenue, By Years, 2023-2024* ($)
Figure 136 Company 2 Unmanned Underwater Vehicles (UUV) Market Net Revenue Share, By Business segments, 2023 (%)
Figure 137 Company 2 Unmanned Underwater Vehicles (UUV) Market Net Sales Share, By Geography, 2023 (%)
Figure 138 Company 3Unmanned Underwater Vehicles (UUV) Market Net Revenue, By Years, 2023-2024* ($)
Figure 139 Company 3Unmanned Underwater Vehicles (UUV) Market Net Revenue Share, By Business segments, 2023 (%)
Figure 140 Company 3Unmanned Underwater Vehicles (UUV) Market Net Sales Share, By Geography, 2023 (%)
Figure 141 Company 4 Unmanned Underwater Vehicles (UUV) Market Net Revenue, By Years, 2023-2024* ($)
Figure 142 Company 4 Unmanned Underwater Vehicles (UUV) Market Net Revenue Share, By Business segments, 2023 (%)
Figure 143 Company 4 Unmanned Underwater Vehicles (UUV) Market Net Sales Share, By Geography, 2023 (%)
Figure 144 Company 5 Unmanned Underwater Vehicles (UUV) Market Net Revenue, By Years, 2023-2024* ($)
Figure 145 Company 5 Unmanned Underwater Vehicles (UUV) Market Net Revenue Share, By Business segments, 2023 (%)
Figure 146 Company 5 Unmanned Underwater Vehicles (UUV) Market Net Sales Share, By Geography, 2023 (%)
Figure 147 Company 6 Unmanned Underwater Vehicles (UUV) Market Net Revenue, By Years, 2023-2024* ($)
Figure 148 Company 6 Unmanned Underwater Vehicles (UUV) Market Net Revenue Share, By Business segments, 2023 (%)
Figure 149 Company 6 Unmanned Underwater Vehicles (UUV) Market Net Sales Share, By Geography, 2023 (%)
Figure 150 Company 7 Unmanned Underwater Vehicles (UUV) Market Net Revenue, By Years, 2023-2024* ($)
Figure 151 Company 7 Unmanned Underwater Vehicles (UUV) Market Net Revenue Share, By Business segments, 2023 (%)
Figure 152 Company 7 Unmanned Underwater Vehicles (UUV) Market Net Sales Share, By Geography, 2023 (%)
Figure 153 Company 8 Unmanned Underwater Vehicles (UUV) Market Net Revenue, By Years, 2023-2024* ($)
Figure 154 Company 8 Unmanned Underwater Vehicles (UUV) Market Net Revenue Share, By Business segments, 2023 (%)
Figure 155 Company 8 Unmanned Underwater Vehicles (UUV) Market Net Sales Share, By Geography, 2023 (%)
Figure 156 Company 9 Unmanned Underwater Vehicles (UUV) Market Net Revenue, By Years, 2023-2024* ($)
Figure 157 Company 9 Unmanned Underwater Vehicles (UUV) Market Net Revenue Share, By Business segments, 2023 (%)
Figure 158 Company 9 Unmanned Underwater Vehicles (UUV) Market Net Sales Share, By Geography, 2023 (%)
Figure 159 Company 10 Unmanned Underwater Vehicles (UUV) Market Net Revenue, By Years, 2023-2024* ($)
Figure 160 Company 10 Unmanned Underwater Vehicles (UUV) Market Net Revenue Share, By Business segments, 2023 (%)
Figure 161 Company 10 Unmanned Underwater Vehicles (UUV) Market Net Sales Share, By Geography, 2023 (%)
Figure 162 Company 11 Unmanned Underwater Vehicles (UUV) Market Net Revenue, By Years, 2023-2024* ($)
Figure 163 Company 11 Unmanned Underwater Vehicles (UUV) Market Net Revenue Share, By Business segments, 2023 (%)
Figure 164 Company 11 Unmanned Underwater Vehicles (UUV) Market Net Sales Share, By Geography, 2023 (%)
Figure 165 Company 12 Unmanned Underwater Vehicles (UUV) Market Net Revenue, By Years, 2023-2024* ($)
Figure 166 Company 12 Unmanned Underwater Vehicles (UUV) Market Net Revenue Share, By Business segments, 2023 (%)
Figure 167 Company 12 Unmanned Underwater Vehicles (UUV) Market Net Sales Share, By Geography, 2023 (%)
Figure 168 Company 13Unmanned Underwater Vehicles (UUV) Market Net Revenue, By Years, 2023-2024* ($)
Figure 169 Company 13Unmanned Underwater Vehicles (UUV) Market Net Revenue Share, By Business segments, 2023 (%)
Figure 170 Company 13Unmanned Underwater Vehicles (UUV) Market Net Sales Share, By Geography, 2023 (%)
Figure 171 Company 14 Unmanned Underwater Vehicles (UUV) Market Net Revenue, By Years, 2023-2024* ($)
Figure 172 Company 14 Unmanned Underwater Vehicles (UUV) Market Net Revenue Share, By Business segments, 2023 (%)
Figure 173 Company 14 Unmanned Underwater Vehicles (UUV) Market Net Sales Share, By Geography, 2023 (%)
Figure 174 Company 15 Unmanned Underwater Vehicles (UUV) Market Net Revenue, By Years, 2023-2024* ($)
Figure 175 Company 15 Unmanned Underwater Vehicles (UUV) Market Net Revenue Share, By Business segments, 2023 (%)
Figure 176 Company 15 Unmanned Underwater Vehicles (UUV) Market Net Sales Share, By Geography, 2023 (%)
The Unmanned Underwater Vehicle Market is projected to grow at 10.6% CAGR during the forecast period 2024-2030.
The Unmanned Underwater Vehicle Market size is estimated to be $4.7 billion in 2023 and is projected to reach $9.7 billion by 2030.
The leading players in the Unmanned Underwater Vehicle Market are SAAB AB, Oceaneering International, Inc, Deep Ocean Engineering, General Dynamics Mission Systems, Inc., ECA GROUPand Others.