 Email
Email Print
Print


R22 Refrigerant Market- By HVAC device (Refrigerator, Air conditioner, Others), By Application , By Geography - Global Opportunity Analysis & Industry Forecast, 2024-2030
R22 Refrigerant Market Overview
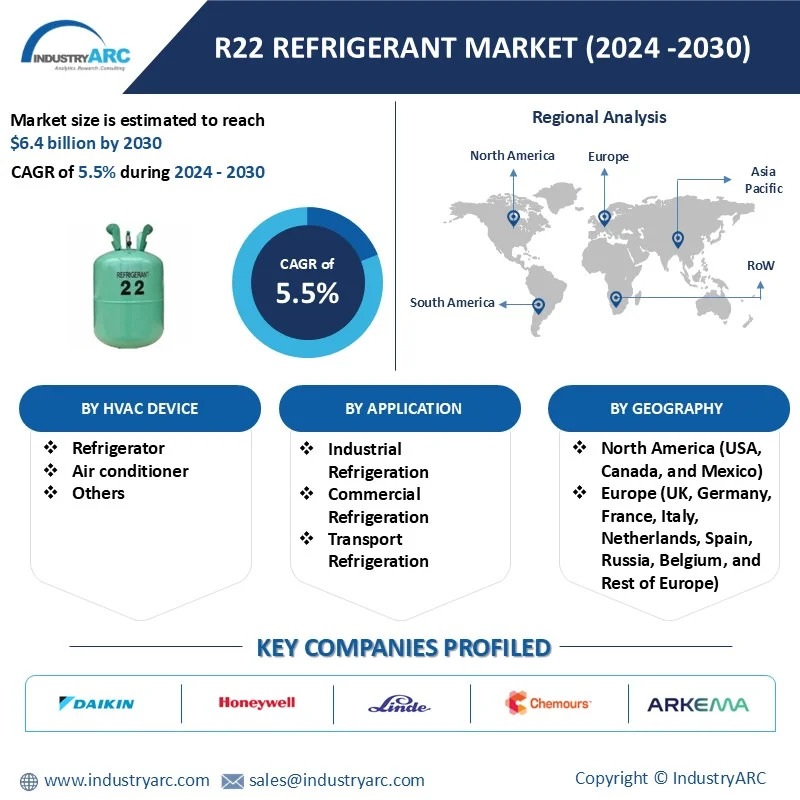
R22 Refrigerant Market size is forecast to reach $6.4 billion by 2030, after growing at a CAGR of 5.5% during 2024-2030. The R22 refrigerant market is driven by refrigeration and air-conditioning application across a wide range of temperatures. R22 refrigerant market is a colourless gas and is known as Chlorodifluoromethane has been used as a substitute for chlorofluorocarbon (CFC) after phase out, which has propelled the demand for R22 refrigerant across various segments.
The R22 refrigerant market experiences a pronounced shift due to its ozone-depleting nature. Consequently, a heightened demand emerges for alternative refrigerants, driven by stringent environmental regulations mandating the phase-out of R22. This transition fosters an industry-wide pursuit for eco-friendly substitutes, compelling users to adopt new refrigerants compliant with modern environmental standards. The regulatory-driven shift prompts businesses to seek and integrate environmentally safer alternatives, steering the market's focus towards sustainable refrigeration solutions.
The refrigeration industry is transitioning to eco-friendly alternatives like in response to environmental regulations such as the Montreal Protocol. These substitutes, renowned for their lower environmental impact compared to traditional refrigerants like R22, align with sustainability initiatives. This shift, driven by environmental consciousness and regulatory compliance, underscores the industry's commitment to reducing ozone depletion and global warming potential, fostering a greener and more sustainable approach to cooling solutions.
Market Snapshot:
Report Coverage
The report: “R22 Refrigerant Market – Forecast (2024-2030)”, by IndustryARC, covers an in-depth analysis of the following segments of the R22 Refrigerant Industry.
By HVAC Device: Refrigerator, Air conditioner, Others.
By Application: Industrial Refrigeration, Commercial Refrigeration, Transport Refrigeration, Residential & Light Air Conditioning, Industrial / Commercial Air Conditioning DX Chillers, Industrial / Commercial Centrifugal Compressors, Others.
By Geography: North America (USA, Canada, and Mexico), Europe (UK, Germany, France, Italy, Netherlands, Spain, Russia, Belgium, and Rest of Europe), Asia-Pacific (China, Japan, India, South Korea, Australia, Indonesia, Taiwan, Malaysia, and Rest of APAC), South America (Brazil, Argentina, Venezuela, Ecuador, Peru, Costa Rica, Colombia, and Rest of South America), Rest of the World (Middle East and Africa).
Key Takeaways
- Asia-Pacific dominates the R22 refrigerant market owing to strong consumption of air conditioners in China, Japan, and other developing countries.
- The refrigerant industry is focusing towards the alternative to the Ozone Depleting refrigerant. As the industry faces the regulations to phase out Ozone Depleting Substances under the Montreal Protocol.
HVAC Device - Segment Analysis
Air conditioner held the largest share in the R22 refrigerant market in 2023. In 2022, the demand for air conditioning devices worldwide amounted to approximately 117.8 million units. according to The Japan Refrigeration and Air Conditioning Industry Association (JRAIA). According to International Energy Association (IEA) U.S. and China accounts for half of the world’s stock of air conditioners. With the rising population growth, climate condition, falling equipment prices and urbanization, the number of air-conditioning units installed globally is set to jump from about 1.6 billion to 5.6 billion according to IEA. The rise in utilization of air-conditioning units will fuel the demand of R22 refrigerant to be incorporated into air conditioners.
Application - Segment Analysis
Residential and light air conditioning has been the primary market for R22 (Hydrochlorofluorocarbon 22) refrigerant. Global warming caused by greenhouse emissions has raised the temperature and has become one of the major factors behind the increasing demand for HVAC. In 2022, carbon emission rose by 1.5%. According to BP Plc CO2e emissions in Accelerated and Net Zero peak in the early 2020s and by 2050 are around 75% and 95% below 2019 levels respectively. The extreme weather in 2022 resulted in increased demand for air conditioning, according to BP Plc in its annual energy sector review. Building Services Research and Information Association (BSRIA) stated that Residential and light air conditioning will have a modest growth due to urbanization and a rise in people's purchasing power.
Geography - Segment Analysis
APAC dominated the R22 (Hydrochlorofluorocarbon 22) refrigerant market with a share of more than 33%, followed by North America and Europe. According to Energy Foundation China, Between October 2022 and October 2023 the exports of China's Air Conditioners have increased by $70 million (6.98%) from $1 billion to $1.07 billion. APAC showcased unparalleled growth, influencing the global refrigerant landscape significantly. This supremacy reflects robust demand, robust industrial growth, and substantial investments in the refrigerant sector within the APAC region. The lucrative market size and strategic positioning reinforce APAC's pivotal role in shaping the trajectory of the R22 refrigerant market on a global scale.

For more details on this report - Request for Sample
R22 Refrigerant Market Drivers
-
Wide application of R22 refrigerant.
Montreal Protocol (1987), refrigerant R22 (Hydrochlorofluorocarbon 22), the generally accepted and most suitable refrigerant for air conditioners. At present R22 is extensively used in the industries for liquefaction of the gases like chlorine, for supplying chilled water to various processes, machines, chillers of central air conditioning systems, and others. R22 is non-toxic, making this refrigerant highly safe for domestic and industrial purposes is non-flammable.
R22 Refrigerant Market Challenges
-
The substitutes of R22 refrigerant can hamper the market.
Air conditioners transfer heat while circulating refrigerant between the indoor and outdoor units. R-32 is a new refrigerant currently receiving the most interest as R32 can efficiently conveys heat and can reduce electricity consumption up to approximately 10% compared to that of air conditioners using refrigerant R-22. Furthermore, compared to the refrigerants widely used such as R-22 and R-410A R-32 has a one-third lower global warming potential (GWP) and is noteworthy for its low impact on the environment.
-
Stringent environmental regulation
R22 is a single component refrigerant used traditionally across medium and low temperature refrigeration. But it has some severe impact on the environment which has forced the government to put forward stricter regulations. Regulations have increasingly become stricter from greater consideration for the global environment because of the Montreal Protocol in 1987 and the Kyoto Protocol in 1997, resulting in a shift to refrigerants with even lower environmental impact.
Market Landscape
The global graphene top 10 companies include:
Airgas Refrigerants Inc., Arkema, Chemours, Linde Gas, Honeywell, Daikin Industries, and DuPont Chemicals, among others.
Acquisitions/Technology Launches
- In June 2023, Honeywell announced first low carbon district heating network located in Tallaght, Dublin, is using a heat pump with its energy efficient, ultra-low global warming potential hydrofluoroolefin Solstice ze refrigerant.
- In May 2023, The Chemours company announced a capacity investment in its low global warming potential Opteon 1100 foam blowing agent and opteon SF33 speciality fluid.
For more Chemicals and Materials Market reports, please click here
1.R22 Refrigerant Market - Overview
1.1. Definitions and Scope
2. R22 Refrigerant Market - Executive summary
2.1. Market Revenue, Market Size and Key Trends by Company
2.2. Key Trends by type of Application
2.3. Key Trends segmented by Geography
3. R22 Refrigerant Market
3.1. Comparative analysis
3.1.1. Product Benchmarking - Top 10 companies
3.1.2. Top 5 Financials Analysis
3.1.3. Market Value split by Top 10 companies
3.1.4. Patent Analysis - Top 10 companies
3.1.5. Pricing Analysis
4. R22 Refrigerant Market – Startup companies Scenario Premium
4.1. Top 10 startup company Analysis by
4.1.1. Investment
4.1.2. Revenue
4.1.3. Market Shares
4.1.4. Market Size and Application Analysis
4.1.5. Venture Capital and Funding Scenario
5. R22 Refrigerant Market – Industry Market Entry Scenario Premium
5.1. Regulatory Framework Overview
5.2. New Business and Ease of Doing business index
5.3. Case studies of successful ventures
5.4. Customer Analysis – Top 10 companies
6. R22 Refrigerant Market Forces
6.1. Drivers
6.2. Constraints
6.3. Challenges
6.4. Porters five force model
6.4.1. Bargaining power of suppliers
6.4.2. Bargaining powers of customers
6.4.3. Threat of new entrants
6.4.4. Rivalry among existing players
6.4.5. Threat of substitutes
7. R22 Refrigerant Market -Strategic analysis
7.1. Value chain analysis
7.2. Opportunities analysis
7.3. Product life cycle
7.4. Suppliers and distributors Market Share
8. R22 Refrigerant Market – By HVAC device (Market Size -$Million / $Billion)
8.1. Market Size and Market Share Analysis
8.2. Application Revenue and Trend Research
8.3. Product Segment Analysis
8.3.1. Refrigerator
8.3.2. Air conditioner
8.3.3. Others
9. R22 Refrigerant Market – By Application (Market Size -$Million / $Billion)
9.1. Industrial Refrigeration
9.2. Commercial Refrigeration
9.3. Transport Refrigeration
9.4. Residential & Light Air Conditioning
9.5. Industrial / Commercial Air Conditioning DX Chillers
9.6. Industrial / Commercial Centrifugal Compressors
9.7. Others
10. R22 Refrigerant - By Geography (Market Size -$Million / $Billion)
10.1. R22 Refrigerant Market - North America Segment Research
10.2. North America Market Research (Million / $Billion)
10.2.1. Segment type Size and Market Size Analysis
10.2.2. Revenue and Trends
10.2.3. Application Revenue and Trends by type of Application
10.2.4. Company Revenue and Product Analysis
10.2.5. North America Product type and Application Market Size
10.2.5.1. U.S.
10.2.5.2. Canada
10.2.5.3. Mexico
10.2.5.4. Rest of North America
10.3. R22 Refrigerant - South America Segment Research
10.4. South America Market Research (Market Size -$Million / $Billion)
10.4.1. Segment type Size and Market Size Analysis
10.4.2. Revenue and Trends
10.4.3. Application Revenue and Trends by type of Application
10.4.4. Company Revenue and Product Analysis
10.4.5. South America Product type and Application Market Size
10.4.5.1. Brazil
10.4.5.2. Venezuela
10.4.5.3. Argentina
10.4.5.4. Ecuador
10.4.5.5. Peru
10.4.5.6. Colombia
10.4.5.7. Costa Rica
10.4.5.8. Rest of South America
10.5. R22 Refrigerant - Europe Segment Research
10.6. Europe Market Research (Market Size -$Million / $Billion)
10.6.1. Segment type Size and Market Size Analysis
10.6.2. Revenue and Trends
10.6.3. Application Revenue and Trends by type of Application
10.6.4. Company Revenue and Product Analysis
10.6.5. Europe Segment Product type and Application Market Size
10.6.5.1. U.K
10.6.5.2. Germany
10.6.5.3. Italy
10.6.5.4. France
10.6.5.5. Netherlands
10.6.5.6. Belgium
10.6.5.7. Spain
10.6.5.8. Denmark
10.6.5.9. Rest of Europe
10.7. R22 Refrigerant – APAC Segment Research
10.8. APAC Market Research (Market Size -$Million / $Billion)
10.8.1. Segment type Size and Market Size Analysis
10.8.2. Revenue and Trends
10.8.3. Application Revenue and Trends by type of Application
10.8.4. Company Revenue and Product Analysis
10.8.5. APAC Segment – Product type and Application Market Size
10.8.5.1. China
10.8.5.2. Australia
10.8.5.3. Japan
10.8.5.4. South Korea
10.8.5.5. India
10.8.5.6. Taiwan
10.8.5.7. Malaysia
11. R22 Refrigerant Market - Entropy
11.1. New product launches
11.2. M&A's, collaborations, JVs and partnerships
12. R22 Refrigerant Market – Industry / Segment Competition landscape Premium
12.1. Market Share Analysis
12.1.1. Market Share by Country- Top companies
12.1.2. Market Share by Region- Top 10 companies
12.1.3. Market Share by type of Application – Top 10 companies
12.1.4. Market Share by type of Product / Product category- Top 10 companies
12.1.5. Market Share at global level- Top 10 companies
12.1.6. Best Practises for companies
13. R22 Refrigerant Market – Key Company List by Country Premium
14. R22 Refrigerant Market Company Analysis
14.1. Market Share, Company Revenue, Products, M&A, Developments
14.2. Airgas Refrigerants Inc. (Hudson Technologies)
14.3. Arkema
14.4. Chemours
14.5. Linde Gas
14.6. Honeywell
14.7. Daikin Industries
14.8. Climalife (Dehon Group)
14.9. Shandong Yuean Chemicals
14.10. DuPont Chemicals
15. R22 Refrigerant Market -Appendix
15.1. Abbreviations
15.2. Sources
16. R22 Refrigerant Market -Methodology Premium
16.1. Research Methodology
16.1.1. Company Expert Interviews
16.1.2. Industry Databases
16.1.3. Associations
16.1.4. Company News
16.1.5. Company Annual Reports
16.1.6. Application Trends
16.1.7. New Products and Product database
16.1.8. Company Transcripts
16.1.9. R&D Trends
16.1.10. Key Opinion Leaders Interviews
16.1.11. Supply and Demand Trends
"*Financials would be provided on a best-efforts basis for private companies"
List of Tables:
Table 1: R22 Refrigerant Market Overview 2023-2030
Table 2: R22 Refrigerant Market Leader Analysis 2023-2030 (US$)
Table 3: R22 Refrigerant Market Product Analysis 2023-2030 (US$)
Table 4: R22 Refrigerant Market End User Analysis 2023-2030 (US$)
Table 5: R22 Refrigerant Market Patent Analysis 2013-2023* (US$)
Table 6: R22 Refrigerant Market Financial Analysis 2023-2030 (US$)
Table 7: R22 Refrigerant Market Driver Analysis 2023-2030 (US$)
Table 8: R22 Refrigerant Market Challenges Analysis 2023-2030 (US$)
Table 9: R22 Refrigerant Market Constraint Analysis 2023-2030 (US$)
Table 10: R22 Refrigerant Market Supplier Bargaining Power Analysis 2023-2030 (US$)
Table 11: R22 Refrigerant Market Buyer Bargaining Power Analysis 2023-2030 (US$)
Table 12: R22 Refrigerant Market Threat of Substitutes Analysis 2023-2030 (US$)
Table 13: R22 Refrigerant Market Threat of New Entrants Analysis 2023-2030 (US$)
Table 14: R22 Refrigerant Market Degree of Competition Analysis 2023-2030 (US$)
Table 15: R22 Refrigerant Market Value Chain Analysis 2023-2030 (US$)
Table 16: R22 Refrigerant Market Pricing Analysis 2023-2030 (US$)
Table 17: R22 Refrigerant Market Opportunities Analysis 2023-2030 (US$)
Table 18: R22 Refrigerant Market Product Life Cycle Analysis 2023-2030 (US$)
Table 19: R22 Refrigerant Market Supplier Analysis 2023-2030 (US$)
Table 20: R22 Refrigerant Market Distributor Analysis 2023-2030 (US$)
Table 21: R22 Refrigerant Market Trend Analysis 2023-2030 (US$)
Table 22: R22 Refrigerant Market Size 2023 (US$)
Table 23: R22 Refrigerant Market Forecast Analysis 2023-2030 (US$)
Table 24: R22 Refrigerant Market Sales Forecast Analysis 2023-2030 (Units)
Table 25: R22 Refrigerant Market, Revenue & Volume, By HVAC device, 2023-2030 ($)
Table 26: R22 Refrigerant Market By HVAC device, Revenue & Volume, By Refrigerator, 2023-2030 ($)
Table 27: R22 Refrigerant Market By HVAC device, Revenue & Volume, By Air conditioner, 2023-2030 ($)
Table 28: R22 Refrigerant Market, Revenue & Volume, By Application, 2023-2030 ($)
Table 29: R22 Refrigerant Market By Application, Revenue & Volume, By Industrial Refrigeration, 2023-2030 ($)
Table 30: R22 Refrigerant Market By Application, Revenue & Volume, By Commercial Refrigeration, 2023-2030 ($)
Table 31: R22 Refrigerant Market By Application, Revenue & Volume, By Residential & Light Air Conditioning, 2023-2030 ($)
Table 32: R22 Refrigerant Market By Application, Revenue & Volume, By Industrial / Commercial Air Conditioning DX Chillers, 2023-2030 ($)
Table 33: R22 Refrigerant Market By Application, Revenue & Volume, By Industrial / Commercial Centrifugal Compressors, 2023-2030 ($)
Table 34: North America R22 Refrigerant Market, Revenue & Volume, By HVAC device, 2023-2030 ($)
Table 35: North America R22 Refrigerant Market, Revenue & Volume, By Application, 2023-2030 ($)
Table 36: South america R22 Refrigerant Market, Revenue & Volume, By HVAC device, 2023-2030 ($)
Table 37: South america R22 Refrigerant Market, Revenue & Volume, By Application, 2023-2030 ($)
Table 38: Europe R22 Refrigerant Market, Revenue & Volume, By HVAC device, 2023-2030 ($)
Table 39: Europe R22 Refrigerant Market, Revenue & Volume, By Application, 2023-2030 ($)
Table 40: APAC R22 Refrigerant Market, Revenue & Volume, By HVAC device, 2023-2030 ($)
Table 41: APAC R22 Refrigerant Market, Revenue & Volume, By Application, 2023-2030 ($)
Table 42: Middle East & Africa R22 Refrigerant Market, Revenue & Volume, By HVAC device, 2023-2030 ($)
Table 43: Middle East & Africa R22 Refrigerant Market, Revenue & Volume, By Application, 2023-2030 ($)
Table 44: Russia R22 Refrigerant Market, Revenue & Volume, By HVAC device, 2023-2030 ($)
Table 45: Russia R22 Refrigerant Market, Revenue & Volume, By Application, 2023-2030 ($)
Table 46: Israel R22 Refrigerant Market, Revenue & Volume, By HVAC device, 2023-2030 ($)
Table 47: Israel R22 Refrigerant Market, Revenue & Volume, By Application, 2023-2030 ($)
Table 48: Top Companies 2023 (US$) R22 Refrigerant Market, Revenue & Volume
Table 49: Product Launch 2023-2030 R22 Refrigerant Market, Revenue & Volume
Table 50: Mergers & Acquistions 2023-2030 R22 Refrigerant Market, Revenue & Volume
List of Figures:
Figure 1: Overview of R22 Refrigerant Market 2023-2030
Figure 2: Market Share Analysis for R22 Refrigerant Market 2023 (US$)
Figure 3: Product Comparison in R22 Refrigerant Market 2023-2030 (US$)
Figure 4: End User Profile for R22 Refrigerant Market 2023-2030 (US$)
Figure 5: Patent Application and Grant in R22 Refrigerant Market 2013-2023* (US$)
Figure 6: Top 5 Companies Financial Analysis in R22 Refrigerant Market 2023-2030 (US$)
Figure 7: Market Entry Strategy in R22 Refrigerant Market 2023-2030
Figure 8: Ecosystem Analysis in R22 Refrigerant Market 2023
Figure 9: Average Selling Price in R22 Refrigerant Market 2023-2030
Figure 10: Top Opportunites in R22 Refrigerant Market 2023-2030
Figure 11: Market Life Cycle Analysis in R22 Refrigerant Market
Figure 12: GlobalBy HVAC device R22 Refrigerant Market Revenue, 2023-2030 ($)
Figure 13: GlobalBy Application R22 Refrigerant Market Revenue, 2023-2030 ($)
Figure 14: Global R22 Refrigerant Market - By Geography
Figure 15: Global R22 Refrigerant Market Value & Volume, By Geography, 2023-2030 ($)
Figure 16: Global R22 Refrigerant Market CAGR, By Geography, 2023-2030 (%)
Figure 17: North America R22 Refrigerant Market Value & Volume, 2023-2030 ($)
Figure 18: US R22 Refrigerant Market Value & Volume, 2023-2030 ($)
Figure 19: US GDP and Population, 2023-2030 ($)
Figure 20: US GDP – Composition of 2023, By Sector of Origin
Figure 21: US Export and Import Value & Volume, 2023-2030 ($)
Figure 22: Canada R22 Refrigerant Market Value & Volume, 2023-2030 ($)
Figure 23: Canada GDP and Population, 2023-2030 ($)
Figure 24: Canada GDP – Composition of 2023, By Sector of Origin
Figure 25: Canada Export and Import Value & Volume, 2023-2030 ($)
Figure 26: Mexico R22 Refrigerant Market Value & Volume, 2023-2030 ($)
Figure 27: Mexico GDP and Population, 2023-2030 ($)
Figure 28: Mexico GDP – Composition of 2023, By Sector of Origin
Figure 29: Mexico Export and Import Value & Volume, 2023-2030 ($)
Figure 30: South America R22 Refrigerant Market Value & Volume, 2023-2030 ($)
Figure 31: Brazil R22 Refrigerant Market Value & Volume, 2023-2030 ($)
Figure 32: Brazil GDP and Population, 2023-2030 ($)
Figure 33: Brazil GDP – Composition of 2023, By Sector of Origin
Figure 34: Brazil Export and Import Value & Volume, 2023-2030 ($)
Figure 35: Venezuela R22 Refrigerant Market Value & Volume, 2023-2030 ($)
Figure 36: Venezuela GDP and Population, 2023-2030 ($)
Figure 37: Venezuela GDP – Composition of 2023, By Sector of Origin
Figure 38: Venezuela Export and Import Value & Volume, 2023-2030 ($)
Figure 39: Argentina R22 Refrigerant Market Value & Volume, 2023-2030 ($)
Figure 40: Argentina GDP and Population, 2023-2030 ($)
Figure 41: Argentina GDP – Composition of 2023, By Sector of Origin
Figure 42: Argentina Export and Import Value & Volume, 2023-2030 ($)
Figure 43: Ecuador R22 Refrigerant Market Value & Volume, 2023-2030 ($)
Figure 44: Ecuador GDP and Population, 2023-2030 ($)
Figure 45: Ecuador GDP – Composition of 2023, By Sector of Origin
Figure 46: Ecuador Export and Import Value & Volume, 2023-2030 ($)
Figure 47: Peru R22 Refrigerant Market Value & Volume, 2023-2030 ($)
Figure 48: Peru GDP and Population, 2023-2030 ($)
Figure 49: Peru GDP – Composition of 2023, By Sector of Origin
Figure 50: Peru Export and Import Value & Volume, 2023-2030 ($)
Figure 51: Colombia R22 Refrigerant Market Value & Volume, 2023-2030 ($)
Figure 52: Colombia GDP and Population, 2023-2030 ($)
Figure 53: Colombia GDP – Composition of 2023, By Sector of Origin
Figure 54: Colombia Export and Import Value & Volume, 2023-2030 ($)
Figure 55: Costa Rica R22 Refrigerant Market Value & Volume, 2023-2030 ($)
Figure 56: Costa Rica GDP and Population, 2023-2030 ($)
Figure 57: Costa Rica GDP – Composition of 2023, By Sector of Origin
Figure 58: Costa Rica Export and Import Value & Volume, 2023-2030 ($)
Figure 59: Europe R22 Refrigerant Market Value & Volume, 2023-2030 ($)
Figure 60: U.K R22 Refrigerant Market Value & Volume, 2023-2030 ($)
Figure 61: U.K GDP and Population, 2023-2030 ($)
Figure 62: U.K GDP – Composition of 2023, By Sector of Origin
Figure 63: U.K Export and Import Value & Volume, 2023-2030 ($)
Figure 64: Germany R22 Refrigerant Market Value & Volume, 2023-2030 ($)
Figure 65: Germany GDP and Population, 2023-2030 ($)
Figure 66: Germany GDP – Composition of 2023, By Sector of Origin
Figure 67: Germany Export and Import Value & Volume, 2023-2030 ($)
Figure 68: Italy R22 Refrigerant Market Value & Volume, 2023-2030 ($)
Figure 69: Italy GDP and Population, 2023-2030 ($)
Figure 70: Italy GDP – Composition of 2023, By Sector of Origin
Figure 71: Italy Export and Import Value & Volume, 2023-2030 ($)
Figure 72: France R22 Refrigerant Market Value & Volume, 2023-2030 ($)
Figure 73: France GDP and Population, 2023-2030 ($)
Figure 74: France GDP – Composition of 2023, By Sector of Origin
Figure 75: France Export and Import Value & Volume, 2023-2030 ($)
Figure 76: Netherlands R22 Refrigerant Market Value & Volume, 2023-2030 ($)
Figure 77: Netherlands GDP and Population, 2023-2030 ($)
Figure 78: Netherlands GDP – Composition of 2023, By Sector of Origin
Figure 79: Netherlands Export and Import Value & Volume, 2023-2030 ($)
Figure 80: Belgium R22 Refrigerant Market Value & Volume, 2023-2030 ($)
Figure 81: Belgium GDP and Population, 2023-2030 ($)
Figure 82: Belgium GDP – Composition of 2023, By Sector of Origin
Figure 83: Belgium Export and Import Value & Volume, 2023-2030 ($)
Figure 84: Spain R22 Refrigerant Market Value & Volume, 2023-2030 ($)
Figure 85: Spain GDP and Population, 2023-2030 ($)
Figure 86: Spain GDP – Composition of 2023, By Sector of Origin
Figure 87: Spain Export and Import Value & Volume, 2023-2030 ($)
Figure 88: Denmark R22 Refrigerant Market Value & Volume, 2023-2030 ($)
Figure 89: Denmark GDP and Population, 2023-2030 ($)
Figure 90: Denmark GDP – Composition of 2023, By Sector of Origin
Figure 91: Denmark Export and Import Value & Volume, 2023-2030 ($)
Figure 92: APAC R22 Refrigerant Market Value & Volume, 2023-2030 ($)
Figure 93: China R22 Refrigerant Market Value & Volume, 2023-2030
Figure 94: China GDP and Population, 2023-2030 ($)
Figure 95: China GDP – Composition of 2023, By Sector of Origin
Figure 96: China Export and Import Value & Volume, 2023-2030 ($) R22 Refrigerant Market China Export and Import Value & Volume, 2023-2030 ($)
Figure 97: Australia R22 Refrigerant Market Value & Volume, 2023-2030 ($)
Figure 98: Australia GDP and Population, 2023-2030 ($)
Figure 99: Australia GDP – Composition of 2023, By Sector of Origin
Figure 100: Australia Export and Import Value & Volume, 2023-2030 ($)
Figure 101: South Korea R22 Refrigerant Market Value & Volume, 2023-2030 ($)
Figure 102: South Korea GDP and Population, 2023-2030 ($)
Figure 103: South Korea GDP – Composition of 2023, By Sector of Origin
Figure 104: South Korea Export and Import Value & Volume, 2023-2030 ($)
Figure 105: India R22 Refrigerant Market Value & Volume, 2023-2030 ($)
Figure 106: India GDP and Population, 2023-2030 ($)
Figure 107: India GDP – Composition of 2023, By Sector of Origin
Figure 108: India Export and Import Value & Volume, 2023-2030 ($)
Figure 109: Taiwan R22 Refrigerant Market Value & Volume, 2023-2030 ($)
Figure 110: Taiwan GDP and Population, 2023-2030 ($)
Figure 111: Taiwan GDP – Composition of 2023, By Sector of Origin
Figure 112: Taiwan Export and Import Value & Volume, 2023-2030 ($)
Figure 113: Malaysia R22 Refrigerant Market Value & Volume, 2023-2030 ($)
Figure 114: Malaysia GDP and Population, 2023-2030 ($)
Figure 115: Malaysia GDP – Composition of 2023, By Sector of Origin
Figure 116: Malaysia Export and Import Value & Volume, 2023-2030 ($)
Figure 117: Hong Kong R22 Refrigerant Market Value & Volume, 2023-2030 ($)
Figure 118: Hong Kong GDP and Population, 2023-2030 ($)
Figure 119: Hong Kong GDP – Composition of 2023, By Sector of Origin
Figure 120: Hong Kong Export and Import Value & Volume, 2023-2030 ($)
Figure 121: Middle East & Africa R22 Refrigerant Market Middle East & Africa 3D Printing Market Value & Volume, 2023-2030 ($)
Figure 122: Russia R22 Refrigerant Market Value & Volume, 2023-2030 ($)
Figure 123: Russia GDP and Population, 2023-2030 ($)
Figure 124: Russia GDP – Composition of 2023, By Sector of Origin
Figure 125: Russia Export and Import Value & Volume, 2023-2030 ($)
Figure 126: Israel R22 Refrigerant Market Value & Volume, 2023-2030 ($)
Figure 127: Israel GDP and Population, 2023-2030 ($)
Figure 128: Israel GDP – Composition of 2023, By Sector of Origin
Figure 129: Israel Export and Import Value & Volume, 2023-2030 ($)
Figure 130: Entropy Share, By Strategies, 2023-2030* (%) R22 Refrigerant Market
Figure 131: Developments, 2023-2030* R22 Refrigerant Market
Figure 132: Company 1 R22 Refrigerant Market Net Revenue, By Years, 2023-2030* ($)
Figure 133: Company 1 R22 Refrigerant Market Net Revenue Share, By Business segments, 2023 (%)
Figure 134: Company 1 R22 Refrigerant Market Net Sales Share, By Geography, 2023 (%)
Figure 135: Company 2 R22 Refrigerant Market Net Revenue, By Years, 2023-2030* ($)
Figure 136: Company 2 R22 Refrigerant Market Net Revenue Share, By Business segments, 2023 (%)
Figure 137: Company 2 R22 Refrigerant Market Net Sales Share, By Geography, 2023 (%)
Figure 138: Company 3 R22 Refrigerant Market Net Revenue, By Years, 2023-2030* ($)
Figure 139: Company 3 R22 Refrigerant Market Net Revenue Share, By Business segments, 2023 (%)
Figure 140: Company 3 R22 Refrigerant Market Net Sales Share, By Geography, 2023 (%)
Figure 141: Company 4 R22 Refrigerant Market Net Revenue, By Years, 2023-2030* ($)
Figure 142: Company 4 R22 Refrigerant Market Net Revenue Share, By Business segments, 2023 (%)
Figure 143: Company 4 R22 Refrigerant Market Net Sales Share, By Geography, 2023 (%)
Figure 144: Company 5 R22 Refrigerant Market Net Revenue, By Years, 2023-2030* ($)
Figure 145: Company 5 R22 Refrigerant Market Net Revenue Share, By Business segments, 2023 (%)
Figure 146: Company 5 R22 Refrigerant Market Net Sales Share, By Geography, 2023 (%)
Figure 147: Company 6 R22 Refrigerant Market Net Revenue, By Years, 2023-2030* ($)
Figure 148: Company 6 R22 Refrigerant Market Net Revenue Share, By Business segments, 2023 (%)
Figure 149: Company 6 R22 Refrigerant Market Net Sales Share, By Geography, 2023 (%)
Figure 150: Company 7 R22 Refrigerant Market Net Revenue, By Years, 2023-2030* ($)
Figure 151: Company 7 R22 Refrigerant Market Net Revenue Share, By Business segments, 2023 (%)
Figure 152: Company 7 R22 Refrigerant Market Net Sales Share, By Geography, 2023 (%)
Figure 153: Company 8 R22 Refrigerant Market Net Revenue, By Years, 2023-2030* ($)
Figure 154: Company 8 R22 Refrigerant Market Net Revenue Share, By Business segments, 2023 (%)
Figure 155: Company 8 R22 Refrigerant Market Net Sales Share, By Geography, 2023 (%)
Figure 156: Company 9 R22 Refrigerant Market Net Revenue, By Years, 2023-2030* ($)
Figure 157: Company 9 R22 Refrigerant Market Net Revenue Share, By Business segments, 2023 (%)
Figure 158: Company 9 R22 Refrigerant Market Net Sales Share, By Geography, 2023 (%)
Figure 159: Company 10 R22 Refrigerant Market Net Revenue, By Years, 2023-2030* ($)
Figure 160: Company 10 R22 Refrigerant Market Net Revenue Share, By Business segments, 2023 (%)
Figure 161: Company 10 R22 Refrigerant Market Net Sales Share, By Geography, 2023 (%)
Figure 162: Company 11 R22 Refrigerant Market Net Revenue, By Years, 2023-2030* ($)
Figure 163: Company 11 R22 Refrigerant Market Net Revenue Share, By Business segments, 2023 (%)
Figure 164: Company 11 R22 Refrigerant Market Net Sales Share, By Geography, 2023 (%)
Figure 165: Company 12 R22 Refrigerant Market Net Revenue, By Years, 2023-2030* ($)
Figure 166: Company 12 R22 Refrigerant Market Net Revenue Share, By Business segments, 2023 (%)
Figure 167: Company 12 R22 Refrigerant Market Net Sales Share, By Geography, 2023 (%)
Figure 168: Company 13 R22 Refrigerant Market Net Revenue, By Years, 2023-2030* ($)
Figure 169: Company 13 R22 Refrigerant Market Net Revenue Share, By Business segments, 2023 (%)
Figure 170: Company 13 R22 Refrigerant Market Net Sales Share, By Geography, 2023 (%)
Figure 171: Company 14 R22 Refrigerant Market Net Revenue, By Years, 2023-2030* ($)
Figure 172: Company 14 R22 Refrigerant Market Net Revenue Share, By Business segments, 2023 (%)
Figure 173: Company 14 R22 Refrigerant Market Net Sales Share, By Geography, 2023 (%)
Figure 174: Company 15 R22 Refrigerant Market Net Revenue, By Years, 2023-2030* ($)
Figure 175: Company 15 R22 Refrigerant Market Net Revenue Share, By Business segments, 2023 (%)
Figure 176: Company 15 R22 Refrigerant Market Net Sales Share, By Geography, 2023 (%)