Blockchain Market- By Type , By End Users , By Deployment type , By Organization Size , By Geography - Global Opportunity Analysis & Industry Forecast, 2024-2030

Report Code: ITR 0134 Report Format: PDF + Excel

Blockchain Market Overview:

Blockchain Market size is forecast to reach $1,235.71 Billion by 2030, after growing at a CAGR of 28.1% during 2024-2030. This growth is driven by the emergence of Blockchain 4.0, which focuses on innovation, speed, user experience, and mass usability. This evolution is closely tied to the integration of Blockchain 4.0 with Web 3.0, aiming to create a decentralized, autonomous, and intelligent internet. Web 3.0 relies on blockchain's decentralized protocols to achieve seamless integration, automation through smart contracts, and censorship-resistant storage of peer-to-peer (P2P) data files. This trend has led to the rise of web 3.0-focused blockchains that prioritize cohesive interoperability, user-friendly interfaces, and the ability to cater to a larger and more diverse user base.

Additionally, the integration of blockchain technology into the development of decentralized Metaverse platforms is transforming the market dynamics. The Metaverse, a virtual reality space envisioned by tech giants like Facebook and Microsoft, is powered by advanced technologies including AI, IoT, AR & VR, cloud computing, and blockchain. Decentralized Metaverse platforms prioritize user autonomy, allowing individuals to own and control their digital assets and experiences. Examples such as Decentraland, Axie Infinity, and Starl showcase the potential of blockchain-powered Metaverse environments, offering users the ability to participate, create, and interact within virtual worlds securely and autonomously. This trend reflects the growing intersection of blockchain technology with virtual reality and the evolution of digital experiences.

Market Snapshot :

Blockchain Market

Blockchain Market - Report Coverage:

The “Blockchain Market Report - Forecast (2024-2030)” by IndustryARC, covers an in-depth analysis of the following segments in the Blockchain Market.
By Type: Public Blockchain, Private Blockchain, Consortium Blockchain and Hybrid Blockchain
By Application: Contract Management, Payment Systems, Provenance, Procurement, Streamlined Business, Improved Transparency, Ownership Transfer, Asset Tracking, Inventory Control
By End Use Industry: Supply Chain Management, Marketing and Advertising, Drugs and Healthcare, Energy and Utilities, Commerce and Retail, Logistics, Environmental Services, Others
By Geography: North America, South America, Europe, APAC, and RoW.

COVID-19 / Ukraine Crisis - Impact Analysis:  

  • The COVID-19 pandemic catalyzed both challenges and opportunities within the blockchain market. On one hand, the economic uncertainty prompted cautious investment behavior, affecting the funding landscape for blockchain startups. However, the pandemic also underscored the need for resilient and transparent supply chains, leading to increased interest in blockchain solutions for supply chain management. Moreover, the crisis accelerated digital transformation efforts, spurring adoption of blockchain technology in sectors like healthcare for secure data sharing and tracking of medical supplies. Despite initial setbacks, COVID-19 ultimately highlighted blockchain's potential to address pressing global challenges.
  • The Russia-Ukraine crisis has had a notable impact on the blockchain market. Geopolitical tensions often spur volatility in traditional financial markets, and the blockchain sector is not immune. During times of uncertainty, investors tend to seek refuge in assets like Bitcoin, which is viewed as a hedge against geopolitical instability. Additionally, blockchain technology offers benefits such as transparency and decentralization, which could be attractive in regions facing political turmoil. However, the crisis may also disrupt blockchain projects and operations in affected areas, potentially leading to delays or uncertainties in development and investment.

Key Takeaways:

  • The Asia-Pacific (APAC) region leads as the fastest-growing market in the blockchain sector, fueled by robust government support, particularly in China, Singapore, and South Korea. With a tech-savvy populace and high smartphone penetration, APAC shows a strong appetite for blockchain solutions across various sectors. The region hosts a thriving ecosystem of blockchain startups, supported by ample venture capital. Enterprises adopt blockchain for its transformative potential, especially in supply chain management and digital identity verification, as cryptocurrency markets thrive, solidifying APAC's position as a global blockchain powerhouse.
  • The public blockchain sector is the fastest-growing market segment, offering transparency, security, and permissionless innovation. Led by platforms like Ethereum and Bitcoin, it enables diverse applications such as cryptocurrencies, DeFi, NFTs, and DApps. Increasingly adopted worldwide by enterprises, governments, and individuals, public blockchains attract significant investment and development. Their inclusive nature fosters a thriving ecosystem, driving rapid expansion and mainstream integration.
  • Contract management leads as the fastest-growing market in the blockchain industry, leveraging the technology's transparency, security, and automation. Smart contracts enable automated agreements, reducing costs and fraud risks. Enterprises adopt blockchain-based systems across sectors like supply chain, finance, and real estate for improved efficiency and compliance. This segment experiences rapid expansion, indicating sustained growth prospects driven by blockchain innovation in contract processes.


Blockchain Market

For more details on this report - Request for Sample

Blockchain Market Segment Analysis – By Type

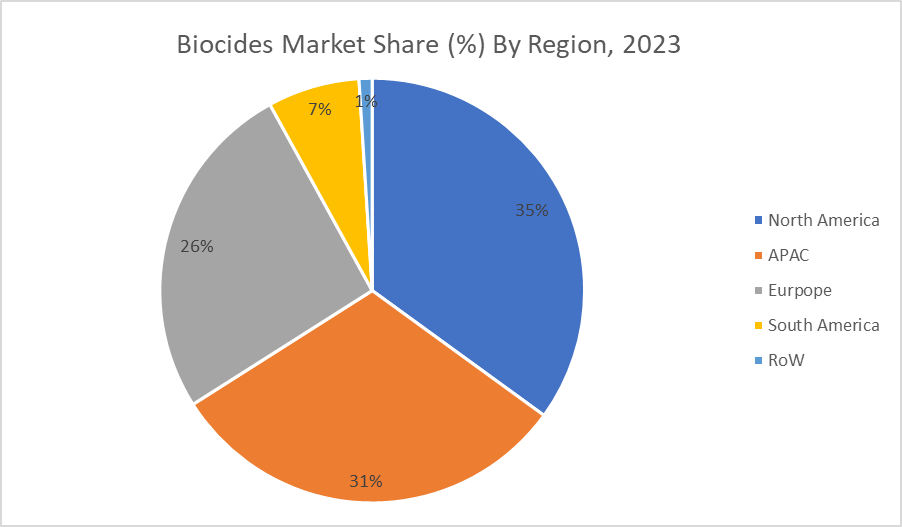
Public blockchains have emerged as the highest-growing type in the blockchain market with a market share of 35% in 2023, due to several key factors. Unlike private or consortium blockchains, public blockchains offer open access to anyone, allowing for permissionless participation and transparency. This open nature fosters a decentralized ecosystem where users can transact, interact, and innovate without relying on intermediaries or centralized authorities. Public blockchains, exemplified by cryptocurrencies like Bitcoin and Ethereum, have gained significant traction and adoption due to their robust security, immutability, and censorship resistance. These attributes make public blockchains ideal for a wide range of use cases, including peer-to-peer payments, decentralized finance (DeFi), decentralized applications (DApps), and tokenization of assets. Furthermore, the vibrant community of developers, enthusiasts, and stakeholders surrounding public blockchains drives continuous innovation and development, leading to the creation of new protocols, applications, and services. As a result, public blockchains are poised for continued growth and expansion, playing a pivotal role in shaping the future of the blockchain industry.

Blockchain Market Segment Analysis – By Application

Payment systems have emerged as the highest-growing application with a CAGR of 29.4% in the forecast period of 2024-2030,  in the blockchain market due to several key factors. Blockchain technology offers unparalleled advantages for payment systems, including enhanced security, transparency, and efficiency. By leveraging blockchain's decentralized ledger, payment transactions can be executed in a trustless and tamper-resistant manner, reducing the need for intermediaries and minimizing transaction costs.  Moreover, blockchain enables cross-border payments to be settled quickly and securely, bypassing traditional banking networks and eliminating delays associated with intermediary banks and currency conversions. This has led to increased adoption of blockchain-based payment solutions by businesses and financial institutions seeking to streamline their payment processes and expand into global markets. Additionally, the rise of cryptocurrencies and digital assets has further propelled the growth of blockchain-based payment systems, as users seek decentralized alternatives to traditional fiat currencies and payment methods. As a result, payment systems have become one of the most significant and rapidly expanding applications of blockchain technology, driving innovation and transformation in the global financial ecosystem.

Blockchain Market Segment Analysis – By End-Use Industry

Supply chain management has emerged as the highest-growing end-use industry with a CAGR of 29.8% in the forecast period of 2024-2030, in the blockchain market due to its potential to revolutionize global trade and logistics. Blockchain technology offers transparency, traceability, and security throughout the supply chain, addressing longstanding challenges such as counterfeit goods, inefficient processes, and lack of trust among stakeholders. By leveraging blockchain, companies can create immutable records of every transaction and movement of goods, from raw material sourcing to final delivery, ensuring authenticity and compliance with regulations. Smart contracts automate and enforce agreements between parties, streamlining processes and reducing disputes. Moreover, blockchain enables real-time visibility into the supply chain, enhancing efficiency, reducing costs, and minimizing risks such as fraud and theft. As a result, businesses across industries, including retail, manufacturing, healthcare, and food, are increasingly adopting blockchain-based supply chain solutions to optimize operations, improve customer trust, and gain competitive advantage in the global marketplace.

Blockchain Market Segment Analysis – By Geography

The Asia-Pacific (APAC) region has emerged as the highest-growing market in the blockchain industry due to several key factors with a CAGR of 30.5% in the forecast period of 2024-2030. With a large and tech-savvy population, APAC nations such as China, Singapore, Japan, and South Korea have embraced blockchain technology, fostering a vibrant ecosystem of startups, developers, and investors. These countries have implemented supportive regulatory frameworks and government initiatives to promote blockchain innovation and adoption.Moreover, APAC's robust digital infrastructure and high smartphone penetration rates provide a fertile ground for blockchain applications across various sectors, including finance, supply chain management, healthcare, and gaming. Additionally, the region's booming cryptocurrency markets and increasing interest in decentralized finance (DeFi) have fueled demand for blockchain-based solutions and services. Overall, the Asia-Pacific region's conducive regulatory environment, technological advancement, and growing market demand position it as a leading hub for blockchain innovation and investment, driving significant growth and expansion in the global blockchain market.

Blockchain Market Drivers 

The Surge in Popularity of Non-Fungible Tokens (NFTs)

The surge in popularity of non-fungible tokens (NFTs) has emerged as a major market driver in the blockchain industry, revolutionizing digital ownership and creating new opportunities for creators, collectors, and investors alike. NFTs are unique digital assets that represent ownership or proof of authenticity of digital items, such as artwork, music, videos, virtual real estate, and collectibles, using blockchain technology. One of the key factors driving the growth of NFTs is their ability to authenticate and verify the ownership and provenance of digital assets, addressing issues of copyright infringement and digital piracy. This has unlocked new revenue streams for creators by enabling them to monetize their digital creations through tokenization and direct sales to a global audience. Moreover, NFTs have democratized access to the art and collectibles market, empowering artists, musicians, and content creators to bypass traditional gatekeepers and establish direct relationships with their audiences. This has led to a flourishing ecosystem of digital artists, collectors, and marketplaces, driving innovation and creativity in the digital arts and entertainment industries. Additionally, the speculative frenzy surrounding NFTs has attracted significant investment and attention from both mainstream and cryptocurrency investors, fueling further growth and adoption of blockchain technology. As a result, NFTs have become a catalyst for broader adoption of blockchain technology beyond the cryptocurrency realm, paving the way for new use cases and applications across industries such as gaming, virtual reality, fashion, and sports.

Ongoing Advancements in Blockchain Technology

Ongoing advancements in blockchain technology represent a significant market driver within the blockchain industry. These advancements continually push the boundaries of what is possible with blockchain, fueling innovation, adoption, and investment across various sectors. One crucial area of advancement is scalability solutions, addressing the challenge of blockchain networks handling large volumes of transactions. Projects such as layer 2 scaling solutions (e.g., Lightning Network for Bitcoin, Ethereum's Layer 2 solutions like Optimistic Rollups and Plasma) aim to increase transaction throughput while reducing fees and congestion. Interoperability protocols are another key focus, enabling different blockchain networks to communicate and share data seamlessly. Projects like Polkadot, Cosmos, and ICON are developing interoperability solutions, allowing for the exchange of assets and information across disparate blockchains. Furthermore, advancements in consensus mechanisms, such as proof-of-stake (PoS) and delegated proof-of-stake (DPoS), offer energy-efficient alternatives to traditional proof-of-work (PoW) systems, reducing environmental impact while maintaining security and decentralization. Privacy and security enhancements, including zero-knowledge proofs, homomorphic encryption, and decentralized identity solutions, are also driving innovation in blockchain technology, addressing concerns about data privacy and security. Overall, ongoing advancements in blockchain technology are vital for overcoming existing limitations, improving scalability, interoperability, security, and sustainability, and unlocking new possibilities for blockchain applications across industries like finance, supply chain, healthcare, and more. As these advancements continue to evolve, they will drive further growth and adoption in the blockchain market.

Blockchain Market Challenges

Lack of Clear and Consistent Regulations Across Jurisdictions 

The lack of clear and consistent regulations across jurisdictions poses a significant challenge for the blockchain market, inhibiting the growth and widespread adoption of blockchain technology. The regulatory landscape surrounding blockchain and cryptocurrencies varies greatly from one country to another, creating uncertainty for businesses, investors, and users alike. The absence of clear guidelines and regulations creates barriers to entry for blockchain startups and projects, as they struggle to navigate complex and often contradictory regulatory requirements. This uncertainty stifles innovation and investment in the blockchain space, as stakeholders hesitate to commit resources to projects that may face regulatory backlash or legal challenges. Moreover, the lack of harmonized regulations across jurisdictions complicates cross-border transactions and operations, hindering the scalability and global expansion of blockchain applications and services. Businesses operating in multiple jurisdictions must contend with a patchwork of regulations, compliance costs, and legal risks, leading to inefficiencies and delays in market growth. Furthermore, regulatory uncertainty undermines consumer confidence and trust in blockchain technology, deterring mainstream adoption and investment. Without clear guidelines and consumer protections in place, individuals may hesitate to engage with blockchain-based products and services, fearing potential legal and financial risks. Addressing the lack of clear and consistent regulations requires collaboration between governments, industry stakeholders, and regulatory bodies to develop standardized frameworks that promote innovation, protect consumers, and ensure compliance across jurisdictions. Such regulatory clarity is essential to unlock the full potential of blockchain technology and foster its responsible and sustainable growth on a global scale.

Market Landscape

Product/Service launches, approvals, patents and events, acquisitions, partnerships and collaborations are key strategies adopted by players in the Blockchain Market. The top 10 companies in this industry are: Sure, here's the list of 10 major players in the blockchain market without descriptions: AWS, SAP, IBM, Intel, Infosys, Wipro, TCS, Microsoft, Accenture and Oracle

Developments:

  • A recent development from Microsoft in the blockchain industry is its partnership with Aptos Labs, announced in August 2023. This collaboration focuses on combining Microsoft's artificial intelligence (AI) technology with Aptos' layer 1 blockchain to develop solutions targeted towards the financial services sector.
  • A recent development by Oracle in the Blockchain industry is the launch of native Non-Fungible Token (NFT) support on its Oracle Blockchain Platform, announced in November 2023. This signifies a significant step for Oracle as it ventures deeper into the world of tokenization and caters to the growing demand for NFTs.

For more Information and Communications Technology related reports, please click here
 

  1.    Blockchain Market - Overview
      1.1.    Definitions and Scope
  2.    Blockchain Market - Executive Summary
      2.1.    Key Trends by Type
      2.2.    Key Trends by Indication
      2.3.    Key Trends by End User
      2.4.    Key Trends by Intake Method
      2.5.    Key Trends by Distribution Channel
      2.6.    Key Trends by Geography
  3.    Blockchain Market - Comparative Analysis
      3.1.    Company Benchmarking - Key Companies
      3.2.    Global Financial Analysis - Key Companies
      3.3.    Market Share Analysis - Key Companies
      3.4.    Patent Analysis
      3.5.    Pricing Analysis
  4.    Blockchain Market - Start-up Companies Scenario
      4.1.    Key Start-up Company Analysis by
            4.1.1.    Investment
            4.1.2.    Revenue
            4.1.3.    Venture Capital and Funding Scenario
  5.    Blockchain Market – Market Entry Scenario Premium
      5.1.    Regulatory Framework Overview
      5.2.    New Business and Ease of Doing Business Index
      5.3.    Case Studies of Successful Ventures
  6.    Blockchain Market - Forces
      6.1.    Market Drivers
      6.2.    Market Constraints
      6.3.    Market Challenges
      6.4.    Porter's Five Force Model
            6.4.1.    Bargaining Power of Suppliers
            6.4.2.    Bargaining Powers of Customers
            6.4.3.    Threat of New Entrants
            6.4.4.    Rivalry Among Existing Players
            6.4.5.    Threat of Substitutes
  7.    Blockchain Market – Strategic Analysis
      7.1.    Value Chain Analysis
      7.2.    Opportunities Analysis
      7.3.    Market Life Cycle
  8.    Blockchain Market – By Type (Market Size – $Million/$Billion) 
      8.1.    Public Blockchain
      8.2.    Private Blockchain
      8.3.    Consortium Blockchain
      8.4.    Hybrid Blockchain
  9.    Blockchain Market – By Application (Market Size – $Million/$Billion)
      9.1.    Contract Management
      9.2.    Payment Systems
      9.3.    Provenance
      9.4.    Procurement
      9.5.    Streamlined Business
      9.6.    Improved Transparency
      9.7.    Ownership Transfer
      9.8.    Asset Tracking
      9.9.    Inventory Control
  10.    Blockchain Market – By End Use Industry (Market Size – $Million/$Billion)
      10.1.    Supply Chain Management
      10.2.    Marketing and Advertising
      10.3.    Drugs and Healthcare
      10.4.    Energy and Utilities
      10.5.    Commerce and Retail
      10.6.    Logistics
      10.7.    Environmental Services
      10.8.    Others
  11.    Blockchain Market – by Geography (Market Size – $Million/$Billion) 
      11.1.    North America
            11.1.1.    The U.S.
            11.1.2.    Canada
            11.1.3.    Mexico
      11.2.    Europe
            11.2.1.    UK
            11.2.2.    Germany
            11.2.3.    France
            11.2.4.    Italy
            11.2.5.    Spain
            11.2.6.    Russia
            11.2.7.    Rest of Europe
      11.3.    Asia-Pacific
            11.3.1.    China
            11.3.2.    India
            11.3.3.    Japan
            11.3.4.    South Korea
            11.3.5.    Australia & New Zealand
            11.3.6.    Rest of Asia-Pacific
      11.4.    South America
            11.4.1.    Brazil
            11.4.2.    Argentina
            11.4.3.    Chile
            11.4.4.    Colombia
            11.4.5.    Rest of South America
      11.5.    Rest of the World
            11.5.1.    Middle East
            11.5.2.    Africa
  12.    Blockchain Market – Entropy
  13.    Blockchain Market – Industry/Segment Competition Landscape  
      13.1.    Market Share Analysis
            13.1.1.    Market Share by Product Type – Key Companies
            13.1.2.    Market Share by Region – Key Companies
            13.1.3.    Market Share by Country – Key Companies
      13.2.    Competition Matrix
      13.3.    Best Practices for Companies
  14.    Blockchain Market – Key Company List by Country Premium
  15.    Blockchain Market - Company Analysis
      15.1.    AWS
      15.2.    SAP
      15.3.    IBM
      15.4.    Intel
      15.5.    Infosys Ltd
      15.6.    Microsoft Corp
      15.7.    Oracle Corp
      15.8.    TCS
      15.9.    Accenture
      15.10.    Wipro Ltd 
  •    "Financials to the Private Companies would be provided on best-effort basis."
   
List of Tables:
 
Table 1: Blockchain Market in Government Overview 2023-2030
Table 2: Blockchain Market in Government Leader Analysis 2023-2030 (US$)
Table 3: Blockchain Market in GovernmentProduct Analysis 2023-2030 (US$)
Table 4: Blockchain Market in GovernmentEnd User Analysis 2023-2030 (US$)
Table 5: Blockchain Market in GovernmentPatent Analysis 2013-2023* (US$)
Table 6: Blockchain Market in GovernmentFinancial Analysis 2023-2030 (US$)
Table 7: Blockchain Market in Government Driver Analysis 2023-2030 (US$)
Table 8: Blockchain Market in GovernmentChallenges Analysis 2023-2030 (US$)
Table 9: Blockchain Market in GovernmentConstraint Analysis 2023-2030 (US$)
Table 10: Blockchain Market in Government Supplier Bargaining Power Analysis 2023-2030 (US$)
Table 11: Blockchain Market in Government Buyer Bargaining Power Analysis 2023-2030 (US$)
Table 12: Blockchain Market in Government Threat of Substitutes Analysis 2023-2030 (US$)
Table 13: Blockchain Market in Government Threat of New Entrants Analysis 2023-2030 (US$)
Table 14: Blockchain Market in Government Degree of Competition Analysis 2023-2030 (US$)
Table 15: Blockchain Market in GovernmentValue Chain Analysis 2023-2030 (US$)
Table 16: Blockchain Market in GovernmentPricing Analysis 2023-2030 (US$)
Table 17: Blockchain Market in GovernmentOpportunities Analysis 2023-2030 (US$)
Table 18: Blockchain Market in GovernmentProduct Life Cycle Analysis 2023-2030 (US$)
Table 19: Blockchain Market in GovernmentSupplier Analysis 2023-2030 (US$)
Table 20: Blockchain Market in GovernmentDistributor Analysis 2023-2030 (US$)
Table 21: Blockchain Market in Government Trend Analysis 2023-2030 (US$)
Table 22: Blockchain Market in Government Size 2023 (US$)
Table 23: Blockchain Market in Government Forecast Analysis 2023-2030 (US$)
Table 24: Blockchain Market in Government Sales Forecast Analysis 2023-2030 (Units)
Table 25: Blockchain Market in Government, Revenue & Volume,By Type, 2023-2030 ($)
Table 26: Blockchain Market in GovernmentBy Type, Revenue & Volume,By Public Blockchain, 2023-2030 ($)
Table 27: Blockchain Market in GovernmentBy Type, Revenue & Volume,By Private Blockchain, 2023-2030 ($)
Table 28: Blockchain Market in GovernmentBy Type, Revenue & Volume,By Consortium Blockchain, 2023-2030 ($)
Table 29: Blockchain Market in Government, Revenue & Volume,By Application, 2023-2030 ($)
Table 30: Blockchain Market in GovernmentBy Application, Revenue & Volume,By Smart Contracts, 2023-2030 ($)
Table 31: Blockchain Market in GovernmentBy Application, Revenue & Volume,By Payments Systems, 2023-2030 ($)
Table 32: Blockchain Market in GovernmentBy Application, Revenue & Volume,By Voting, 2023-2030 ($)
Table 33: Blockchain Market in GovernmentBy Application, Revenue & Volume,By Land and other Assets registry, 2023-2030 ($)
Table 34: Blockchain Market in GovernmentBy Application, Revenue & Volume,By Digital Identity, 2023-2030 ($)
Table 35: North America Blockchain Market in Government, Revenue & Volume,By Type, 2023-2030 ($)
Table 36: North America Blockchain Market in Government, Revenue & Volume,By Application, 2023-2030 ($)
Table 37: South america Blockchain Market in Government, Revenue & Volume,By Type, 2023-2030 ($)
Table 38: South america Blockchain Market in Government, Revenue & Volume,By Application, 2023-2030 ($)
Table 39: Europe Blockchain Market in Government, Revenue & Volume,By Type, 2023-2030 ($)
Table 40: Europe Blockchain Market in Government, Revenue & Volume,By Application, 2023-2030 ($)
Table 41: APAC Blockchain Market in Government, Revenue & Volume,By Type, 2023-2030 ($)
Table 42: APAC Blockchain Market in Government, Revenue & Volume,By Application, 2023-2030 ($)
Table 43: Middle East & Africa Blockchain Market in Government, Revenue & Volume,By Type, 2023-2030 ($)
Table 44: Middle East & Africa Blockchain Market in Government, Revenue & Volume,By Application, 2023-2030 ($)
Table 45: Russia Blockchain Market in Government, Revenue & Volume,By Type, 2023-2030 ($)
Table 46: Russia Blockchain Market in Government, Revenue & Volume,By Application, 2023-2030 ($)
Table 47: Israel Blockchain Market in Government, Revenue & Volume,By Type, 2023-2030 ($)
Table 48: Israel Blockchain Market in Government, Revenue & Volume,By Application, 2023-2030 ($)
Table 49: Top Companies 2023 (US$) Blockchain Market in Government, Revenue & Volume,,
Table 50: Product Launch 2023-2030 Blockchain Market in Government, Revenue & Volume,,
Table 51: Mergers & Acquistions 2023-2030 Blockchain Market in Government, Revenue & Volume,,
 
 
List of Figures:
 
Figure 1: Overview of Blockchain Market in Government 2023-2030
Figure 2: Market Share Analysis for Blockchain Market in Government 2023 (US$)
Figure 3: Product Comparison in Blockchain Market in Government 2023-2030 (US$)
Figure 4: End User Profile for Blockchain Market in Government 2023-2030 (US$)
Figure 5: Patent Application and Grant in Blockchain Market in Government 2013-2023* (US$)
Figure 6: Top 5 Companies Financial Analysis in Blockchain Market in Government 2023-2030 (US$)
Figure 7: Market Entry Strategy in Blockchain Market in Government 2023-2030
Figure 8: Ecosystem Analysis in Blockchain Market in Government2023
Figure 9: Average Selling Price in Blockchain Market in Government 2023-2030
Figure 10: Top Opportunites in Blockchain Market in Government 2023-2030
Figure 11: Market Life Cycle Analysis in Blockchain Market in Government
Figure 12: GlobalBy Type Blockchain Market in Government Revenue, 2023-2030 ($)
Figure 13: GlobalBy Application Blockchain Market in Government Revenue, 2023-2030 ($)
Figure 14: Global Blockchain Market in Government - By Geography
Figure 15: Global Blockchain Market in Government Value & Volume, By Geography, 2023-2030 ($) 
Figure 16: Global Blockchain Market in Government CAGR, By Geography, 2023-2030 (%)
Figure 17: North America Blockchain Market in Government Value & Volume, 2023-2030 ($)
Figure 18: US Blockchain Market in Government Value & Volume, 2023-2030 ($)
Figure 19: US GDP and Population, 2023-2030 ($)
Figure 20: US GDP – Composition of 2023, By Sector of Origin
Figure 21: US Export and Import Value & Volume, 2023-2030 ($)
Figure 22: Canada Blockchain Market in Government Value & Volume, 2023-2030 ($)
Figure 23: Canada GDP and Population, 2023-2030 ($)
Figure 24: Canada GDP – Composition of 2023, By Sector of Origin
Figure 25: Canada Export and Import Value & Volume, 2023-2030 ($)
Figure 26: Mexico Blockchain Market in Government Value & Volume, 2023-2030 ($)
Figure 27: Mexico GDP and Population, 2023-2030 ($)
Figure 28: Mexico GDP – Composition of 2023, By Sector of Origin
Figure 29: Mexico Export and Import Value & Volume, 2023-2030 ($)
Figure 30: South America Blockchain Market in GovernmentValue & Volume, 2023-2030 ($)
Figure 31: Brazil Blockchain Market in Government Value & Volume, 2023-2030 ($)
Figure 32: Brazil GDP and Population, 2023-2030 ($)
Figure 33: Brazil GDP – Composition of 2023, By Sector of Origin
Figure 34: Brazil Export and Import Value & Volume, 2023-2030 ($)
Figure 35: Venezuela Blockchain Market in Government Value & Volume, 2023-2030 ($)
Figure 36: Venezuela GDP and Population, 2023-2030 ($)
Figure 37: Venezuela GDP – Composition of 2023, By Sector of Origin
Figure 38: Venezuela Export and Import Value & Volume, 2023-2030 ($)
Figure 39: Argentina Blockchain Market in Government Value & Volume, 2023-2030 ($)
Figure 40: Argentina GDP and Population, 2023-2030 ($)
Figure 41: Argentina GDP – Composition of 2023, By Sector of Origin
Figure 42: Argentina Export and Import Value & Volume, 2023-2030 ($)
Figure 43: Ecuador Blockchain Market in Government Value & Volume, 2023-2030 ($)
Figure 44: Ecuador GDP and Population, 2023-2030 ($)
Figure 45: Ecuador GDP – Composition of 2023, By Sector of Origin
Figure 46: Ecuador Export and Import Value & Volume, 2023-2030 ($)
Figure 47: Peru Blockchain Market in Government Value & Volume, 2023-2030 ($)
Figure 48: Peru GDP and Population, 2023-2030 ($)
Figure 49: Peru GDP – Composition of 2023, By Sector of Origin
Figure 50: Peru Export and Import Value & Volume, 2023-2030 ($)
Figure 51: Colombia Blockchain Market in Government Value & Volume, 2023-2030 ($)
Figure 52: Colombia GDP and Population, 2023-2030 ($)
Figure 53: Colombia GDP – Composition of 2023, By Sector of Origin
Figure 54: Colombia Export and Import Value & Volume, 2023-2030 ($)
Figure 55: Costa Rica Blockchain Market in Government Value & Volume, 2023-2030 ($)
Figure 56: Costa Rica GDP and Population, 2023-2030 ($)
Figure 57: Costa Rica GDP – Composition of 2023, By Sector of Origin
Figure 58: Costa Rica Export and Import Value & Volume, 2023-2030 ($)
Figure 59: Europe Blockchain Market in Government Value & Volume, 2023-2030 ($)
Figure 60: U.K Blockchain Market in Government Value & Volume, 2023-2030 ($)
Figure 61: U.K GDP and Population, 2023-2030 ($)
Figure 62: U.K GDP – Composition of 2023, By Sector of Origin
Figure 63: U.K Export and Import Value & Volume, 2023-2030 ($)
Figure 64: Germany Blockchain Market in Government Value & Volume, 2023-2030 ($)
Figure 65: Germany GDP and Population, 2023-2030 ($)
Figure 66: Germany GDP – Composition of 2023, By Sector of Origin
Figure 67: Germany Export and Import Value & Volume, 2023-2030 ($)
Figure 68: Italy Blockchain Market in Government Value & Volume, 2023-2030 ($)
Figure 69: Italy GDP and Population, 2023-2030 ($)
Figure 70: Italy GDP – Composition of 2023, By Sector of Origin
Figure 71: Italy Export and Import Value & Volume, 2023-2030 ($)
Figure 72: France Blockchain Market in Government Value & Volume, 2023-2030 ($)
Figure 73: France GDP and Population, 2023-2030 ($)
Figure 74: France GDP – Composition of 2023, By Sector of Origin
Figure 75: France Export and Import Value & Volume, 2023-2030 ($)
Figure 76: Netherlands Blockchain Market in Government Value & Volume, 2023-2030 ($)
Figure 77: Netherlands GDP and Population, 2023-2030 ($)
Figure 78: Netherlands GDP – Composition of 2023, By Sector of Origin
Figure 79: Netherlands Export and Import Value & Volume, 2023-2030 ($)
Figure 80: Belgium Blockchain Market in Government Value & Volume, 2023-2030 ($)
Figure 81: Belgium GDP and Population, 2023-2030 ($)
Figure 82: Belgium GDP – Composition of 2023, By Sector of Origin
Figure 83: Belgium Export and Import Value & Volume, 2023-2030 ($)
Figure 84: Spain Blockchain Market in Government Value & Volume, 2023-2030 ($)
Figure 85: Spain GDP and Population, 2023-2030 ($)
Figure 86: Spain GDP – Composition of 2023, By Sector of Origin
Figure 87: Spain Export and Import Value & Volume, 2023-2030 ($)
Figure 88: Denmark Blockchain Market in Government Value & Volume, 2023-2030 ($)
Figure 89: Denmark GDP and Population, 2023-2030 ($)
Figure 90: Denmark GDP – Composition of 2023, By Sector of Origin
Figure 91: Denmark Export and Import Value & Volume, 2023-2030 ($)
Figure 92: APAC Blockchain Market in Government Value & Volume, 2023-2030 ($)
Figure 93: China Blockchain Market in GovernmentValue & Volume, 2023-2030
Figure 94: China GDP and Population, 2023-2030 ($)
Figure 95: China GDP – Composition of 2023, By Sector of Origin
Figure 96: China Export and Import Value & Volume, 2023-2030 ($) Blockchain Market in GovernmentChina Export and Import Value & Volume, 2023-2030 ($)
Figure 97: Australia Blockchain Market in Government Value & Volume, 2023-2030 ($)
Figure 98: Australia GDP and Population, 2023-2030 ($)
Figure 99: Australia GDP – Composition of 2023, By Sector of Origin
Figure 100: Australia Export and Import Value & Volume, 2023-2030 ($)
Figure 101: South Korea Blockchain Market in Government Value & Volume, 2023-2030 ($)
Figure 102: South Korea GDP and Population, 2023-2030 ($)
Figure 103: South Korea GDP – Composition of 2023, By Sector of Origin
Figure 104: South Korea Export and Import Value & Volume, 2023-2030 ($)
Figure 105: India Blockchain Market in Government Value & Volume, 2023-2030 ($)
Figure 106: India GDP and Population, 2023-2030 ($)
Figure 107: India GDP – Composition of 2023, By Sector of Origin
Figure 108: India Export and Import Value & Volume, 2023-2030 ($)
Figure 109: Taiwan Blockchain Market in Government Value & Volume, 2023-2030 ($)
Figure 110: Taiwan GDP and Population, 2023-2030 ($)
Figure 111: Taiwan GDP – Composition of 2023, By Sector of Origin
Figure 112: Taiwan Export and Import Value & Volume, 2023-2030 ($)
Figure 113: Malaysia Blockchain Market in Government Value & Volume, 2023-2030 ($)
Figure 114: Malaysia GDP and Population, 2023-2030 ($)
Figure 115: Malaysia GDP – Composition of 2023, By Sector of Origin
Figure 116: Malaysia Export and Import Value & Volume, 2023-2030 ($)
Figure 117: Hong Kong Blockchain Market in Government Value & Volume, 2023-2030 ($)
Figure 118: Hong Kong GDP and Population, 2023-2030 ($)
Figure 119: Hong Kong GDP – Composition of 2023, By Sector of Origin
Figure 120: Hong Kong Export and Import Value & Volume, 2023-2030 ($)
Figure 121: Middle East & Africa Blockchain Market in GovernmentMiddle East & Africa 3D Printing Market Value & Volume, 2023-2030 ($)
Figure 122: Russia Blockchain Market in Government Value & Volume, 2023-2030 ($)
Figure 123: Russia GDP and Population, 2023-2030 ($)
Figure 124: Russia GDP – Composition of 2023, By Sector of Origin
Figure 125: Russia Export and Import Value & Volume, 2023-2030 ($)
Figure 126: Israel Blockchain Market in Government Value & Volume, 2023-2030 ($)
Figure 127: Israel GDP and Population, 2023-2030 ($)
Figure 128: Israel GDP – Composition of 2023, By Sector of Origin
Figure 129: Israel Export and Import Value & Volume, 2023-2030 ($)
Figure 130: Entropy Share, By Strategies, 2023-2030* (%) Blockchain Market in Government
Figure 131: Developments, 2023-2030* Blockchain Market in Government
Figure 132: Company 1 Blockchain Market in Government Net Revenue, By Years, 2023-2030* ($)
Figure 133: Company 1 Blockchain Market in Government Net Revenue Share, By Business segments, 2023 (%)
Figure 134: Company 1 Blockchain Market in Government Net Sales Share, By Geography, 2023 (%)
Figure 135: Company 2 Blockchain Market in Government Net Revenue, By Years, 2023-2030* ($)
Figure 136: Company 2 Blockchain Market in Government Net Revenue Share, By Business segments, 2023 (%)
Figure 137: Company 2 Blockchain Market in Government Net Sales Share, By Geography, 2023 (%)
Figure 138: Company 3 Blockchain Market in Government Net Revenue, By Years, 2023-2030* ($)
Figure 139: Company 3 Blockchain Market in Government Net Revenue Share, By Business segments, 2023 (%)
Figure 140: Company 3 Blockchain Market in Government Net Sales Share, By Geography, 2023 (%)
Figure 141: Company 4 Blockchain Market in Government Net Revenue, By Years, 2023-2030* ($)
Figure 142: Company 4 Blockchain Market in Government Net Revenue Share, By Business segments, 2023 (%)
Figure 143: Company 4 Blockchain Market in Government Net Sales Share, By Geography, 2023 (%)
Figure 144: Company 5 Blockchain Market in Government Net Revenue, By Years, 2023-2030* ($)
Figure 145: Company 5 Blockchain Market in Government Net Revenue Share, By Business segments, 2023 (%)
Figure 146: Company 5 Blockchain Market in Government Net Sales Share, By Geography, 2023 (%)
Figure 147: Company 6 Blockchain Market in Government Net Revenue, By Years, 2023-2030* ($)
Figure 148: Company 6 Blockchain Market in Government Net Revenue Share, By Business segments, 2023 (%)
Figure 149: Company 6 Blockchain Market in Government Net Sales Share, By Geography, 2023 (%)
Figure 150: Company 7 Blockchain Market in Government Net Revenue, By Years, 2023-2030* ($)
Figure 151: Company 7 Blockchain Market in Government Net Revenue Share, By Business segments, 2023 (%)
Figure 152: Company 7 Blockchain Market in Government Net Sales Share, By Geography, 2023 (%)
Figure 153: Company 8 Blockchain Market in Government Net Revenue, By Years, 2023-2030* ($)
Figure 154: Company 8 Blockchain Market in Government Net Revenue Share, By Business segments, 2023 (%)
Figure 155: Company 8 Blockchain Market in Government Net Sales Share, By Geography, 2023 (%)
Figure 156: Company 9 Blockchain Market in Government Net Revenue, By Years, 2023-2030* ($)
Figure 157: Company 9 Blockchain Market in Government Net Revenue Share, By Business segments, 2023 (%)
Figure 158: Company 9 Blockchain Market in Government Net Sales Share, By Geography, 2023 (%)
Figure 159: Company 10 Blockchain Market in Government Net Revenue, By Years, 2023-2030* ($)
Figure 160: Company 10 Blockchain Market in Government Net Revenue Share, By Business segments, 2023 (%)
Figure 161: Company 10 Blockchain Market in Government Net Sales Share, By Geography, 2023 (%)
Figure 162: Company 11 Blockchain Market in Government Net Revenue, By Years, 2023-2030* ($)
Figure 163: Company 11 Blockchain Market in Government Net Revenue Share, By Business segments, 2023 (%)
Figure 164: Company 11 Blockchain Market in Government Net Sales Share, By Geography, 2023 (%)
Figure 165: Company 12 Blockchain Market in Government Net Revenue, By Years, 2023-2030* ($)
Figure 166: Company 12 Blockchain Market in Government Net Revenue Share, By Business segments, 2023 (%)
Figure 167: Company 12 Blockchain Market in Government Net Sales Share, By Geography, 2023 (%)
Figure 168: Company 13 Blockchain Market in Government Net Revenue, By Years, 2023-2030* ($)
Figure 169: Company 13 Blockchain Market in Government Net Revenue Share, By Business segments, 2023 (%)
Figure 170: Company 13 Blockchain Market in Government Net Sales Share, By Geography, 2023 (%)
Figure 171: Company 14 Blockchain Market in Government Net Revenue, By Years, 2023-2030* ($)
Figure 172: Company 14 Blockchain Market in Government Net Revenue Share, By Business segments, 2023 (%)
Figure 173: Company 14 Blockchain Market in Government Net Sales Share, By Geography, 2023 (%)
Figure 174: Company 15 Blockchain Market in Government Net Revenue, By Years, 2023-2030* ($)
Figure 175: Company 15 Blockchain Market in Government Net Revenue Share, By Business segments, 2023 (%)
Figure 176: Company 15 Blockchain Market in Government Net Sales Share, By Geography, 2023 (%)