Seismometers Market Overview

- Seismometers Market, By Type: Teleseismometers, Strong-Motion Seismometer, Strain-Beam Seismometer, and Others
- Seismometers Market, By Range: 50 to 750 V/m, 1500 V/m, and 20,000 V/m
- Seismometers Market, By Varieties: Short Period, Long Period, and Broadband
- The report has focused study on seismometers market by basis of output such as: Analog Seismometers, and Digital Seismometers
- This report has been further segmented into major regions, which includes detailed analysis of each region such as: North America, Europe, Asia-Pacific (APAC), and Rest of the World (RoW) covering all the major country level markets in each of the region
The Top 5 companies in the Seismometers Market are:
- Geometrics
- Seistronix
- P.A.S.I. SRL
- Toshniwal Technologies Pvt. Limited
- Guideline Geo
For more Automation and Instrumentation Market reports, please click here
List of Tables:
Table 1: Global Seismometers Market Value, By Type, 2016-2022 ($Million)
Table 2: Global Seismometers Market Value, By Geography, 2016-2022($Million)
Table 3: Americas: Seismometers Market Value, By Type, 2016-2022 ($Million)
Table 4: Americas: Seismometers Market Value, By Country, 2016-2022 ($Million)
Table 5: U.S.: GDP – Composition of 2015, By End Use
Table 6: Canada: GDP – Composition of 2015, By End Use
Table 7: Brazil: GDP – Composition of 2015, By End Use
Table 8: Europe: Seismometers Market Value, By Type, 2016-2022 ($Million)
Table 9: Europe: Seismometers Market Value, By Country, 2016-2022 ($Million)
Table 10: U.K.: GDP – Composition of 2015, By End Use
Table 11: Germany: GDP – Composition of 2015, By End Use
Table 12: France: GDP – Composition of 2015, By End Use
Table 13: APAC: Seismometers Market Value, By Type, 2016-2022 ($Million)
Table 14: APAC: Seismometers Market Value, By Country, 2016-2022 ($Million)
Table 15: China: GDP – Composition of 2015, By End Use
Table 16: Japan: GDP – Composition of 2015, By End Use
Table 17: South Korea: GDP – Composition of 2015, By End Use
Table 18: RoW: Seismometers Market Value, By Type, 2016-2022 ($Million)
Table 19: RoW: Seismometers Market Value, By Region, 2016-2022 ($Million)
Table 20: OYO Corporation: Business Segments
Table 21: OYO Corporation: Product Portfolio
Table 22: Seismic Source Co.: Product Portfolio
Table 23: DMT GmbH & Co. KG: Product/Service Portfolio
List of Figures:
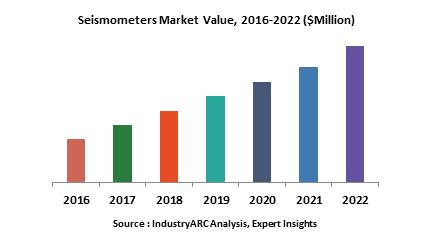
Figure 1: Global Seismometer Market Value, 2016-2022 ($Million)
Figure 2: Global Seismometer Market Value Share, By Type, 2016 (%)
Figure 3: Global Seismometer Market Value Share, By Geography, 2016 (%)
Figure 4: Global Seismometer Market Share, By Key Players, 2016 (%)
Figure 5: Global Seismometer Patent Granted Share, By Country, 2013-2023* (%)
Figure 6: Global Seismometer Granted Patents Share, By Trending Domain, 2013-2023* (%)
Figure 7: Global Seismometer Patents Granted, 2013-2023* (Units)
Figure 8: Seismometers Pricing Analysis, 2015-2023 ($)
Figure 9: Seismometers Market Lifecycle
Figure 10: U.S.: GDP and Population, 2012-2015 ($Trillion, Million)
Figure 11: U.S.: GDP – Composition of 2015, By Sector of Origin
Figure 12: U.S.: Export and Import Value, 2012-2015 ($Trillion)
Figure 13: Canada: GDP and Population, 2012-2015 ($Trillion, Million)
Figure 14: Canada: GDP – Composition of 2015, By Sector of Origin
Figure 15: Canada: Export and Import Value, 2012-2015 ($Billion)
Figure 16: Brazil: GDP and Population, 2012-2015 ($Trillion, Million)
Figure 17: Brazil: GDP – Composition of 2015, By Sector of Origin
Figure 18: Brazil: Export and Import Value, 2012-2015 ($Billion)
Figure 19: U.K.: GDP and Population, 2012-2015 ($Trillion, Million)
Figure 20: U.K.: GDP – Composition of 2015, By Sector of Origin
Figure 21: U.K.: Export and Import Value, 2012-2015 ($Billion)
Figure 22: Germany: GDP and Population, 2012-2015 ($Trillion, Million)
Figure 23: Germany: GDP – Composition of 2015, By Sector of Origin
Figure 24: Germany: Export and Import Value, 2012-2015 ($Billion)
Figure 25: France: GDP and Population, 2012-2015 ($Trillion, Million)
Figure 26: France: GDP – Composition of 2015, By Sector of Origin
Figure 27: France: Export and Import Value, 2012-2015 ($Billion)
Figure 28: China: GDP and Population, 2012-2015 ($Trillion, Million)
Figure 29: China: GDP – Composition of 2015, By Sector of Origin
Figure 30: China: Export and Import Value, 2012-2015 ($Billion)
Figure 31: Japan: GDP and Population, 2012-2015 ($Trillion, Million)
Figure 32: Japan: GDP – Composition of 2015, By Sector of Origin
Figure 33: Japan: Export and Import Value, 2012-2015 ($Billion)
Figure 34: South Korea: GDP and Population, 2012-2015 ($Trillion, Million)
Figure 35: South Korea: GDP – Composition of 2015, By Sector of Origin
Figure 36: South Korea: Export and Import Value, 2012-2015 ($Billion)
Figure 37: Guideline Geo Net Revenue, 2013-2016($Million)
Figure 38: OYO Corporation Net Sales, 2013-2016 ($Billion)
Figure 39: OYO Corporation Net Sales Share, By Business Segment, 2016 (%)
Figure 40: OYO Corporation Net Sales Share, By Geography, 2016 (%)
Figure 41: TUV NORD Group Net Sales, 2013-2016 ($Billion)
Figure 42: TUV NORD Group Net Sales Share, By Business Segment, 2016 (%)
Figure 43: TUV NORD Group Net Sales Share, By Geography, 2016 (%)
 Email
Email Print
Print

