 Email
Email Print
Print


Essential Oils Market - Industry Analysis, Market Size, Share, Trends, Application Analysis, Growth And Forecast 2024-2030
Essential Oils Market Overview
Market Snapshot
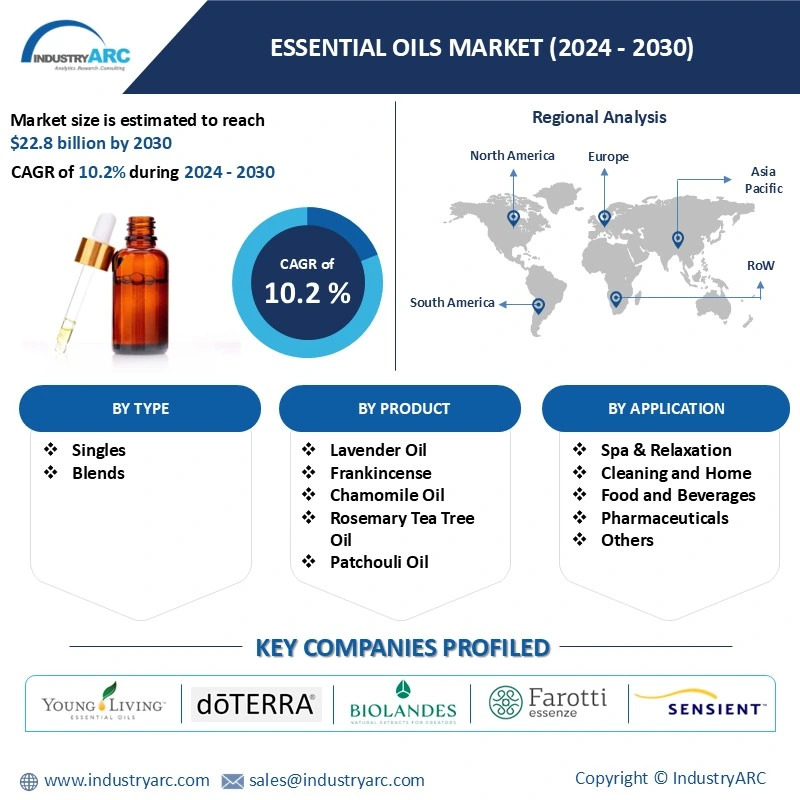
Essential Oils Market Report Coverage

Key Takeaways

Essential Oils Market Segment Analysis - by Product
Essential Oils Market Segment Analysis - by Application
Essential Oils Market Segment Analysis - by Geography
Essential Oils Market Drivers
Increased Awareness Pertinent to the Benefits of Natural Care Products and Ingredients has Proliferated the Demand.
Substantial Demand for Aromatherapy Complimented by Changed Health Awareness Has Proliferated the Market Demand.
Essential Oils Market Challenges
Supply Constraints of Essential Oil along with Comparable Price Increment Impedes Market Growth.
Essential Oils Industry Outlook
- Young Living Essential Oils
- doTERRA International
- Biolandes
- Farotti Essenze Srl
- Sensient Technologies Corporation
- The Lebermuth Company
- NOW Foods
- Mane Kancor Ingredients Pvt Ltd
- Robertet Group
- Norex Flavours Private Limited
Recent Developments
14.2 M&A’s, collaborations, JVs and partnerships
List of Tables
Table 1: Essential Oils Market Overview 2023-2030
Table 2: Essential Oils Market Leader Analysis 2023-2030 (US$)
Table 3: Essential Oils Market Product Analysis 2023-2030 (US$)
Table 4: Essential Oils Market End User Analysis 2023-2030 (US$)
Table 5: Essential Oils Market Patent Analysis 2013-2023* (US$)
Table 6: Essential Oils Market Financial Analysis 2023-2030 (US$)
Table 7: Essential Oils Market Driver Analysis 2023-2030 (US$)
Table 8: Essential Oils Market Challenges Analysis 2023-2030 (US$)
Table 9: Essential Oils Market Constraint Analysis 2023-2030 (US$)
Table 10: Essential Oils Market Supplier Bargaining Power Analysis 2023-2030 (US$)
Table 11: Essential Oils Market Buyer Bargaining Power Analysis 2023-2030 (US$)
Table 12: Essential Oils Market Threat of Substitutes Analysis 2023-2030 (US$)
Table 13: Essential Oils Market Threat of New Entrants Analysis 2023-2030 (US$)
Table 14: Essential Oils Market Degree of Competition Analysis 2023-2030 (US$)
Table 15: Essential Oils Market Value Chain Analysis 2023-2030 (US$)
Table 16: Essential Oils Market Pricing Analysis 2023-2030 (US$)
Table 17: Essential Oils Market Opportunities Analysis 2023-2030 (US$)
Table 18: Essential Oils Market Product Life Cycle Analysis 2023-2030 (US$)
Table 19: Essential Oils Market Supplier Analysis 2023-2030 (US$)
Table 20: Essential Oils Market Distributor Analysis 2023-2030 (US$)
Table 21: Essential Oils Market Trend Analysis 2023-2030 (US$)
Table 22: Essential Oils Market Size 2023 (US$)
Table 23: Essential Oils Market Forecast Analysis 2023-2030 (US$)
Table 24: Essential Oils Market Sales Forecast Analysis 2023-2030 (Units)
Table 25: Essential Oils Market, Revenue & Volume, By Type, 2023-2030 ($)
Table 26: Essential Oils Market, Revenue & Volume, By Product, 2023-2030 ($)
Table 27: Essential Oils Market By Product, Revenue & Volume, By Orange, 2023-2030 ($)
Table 28: Essential Oils Market By Product, Revenue & Volume, By Corn Mint, 2023-2030 ($)
Table 29: Essential Oils Market By Product, Revenue & Volume, By Eucalyptus, 2023-2030 ($)
Table 30: Essential Oils Market By Product, Revenue & Volume, By Citronella, 2023-2030 ($)
Table 31: Essential Oils Market By Product, Revenue & Volume, By Peppermint, 2023-2030 ($)
Table 32: Essential Oils Market, Revenue & Volume, By Application, 2023-2030 ($)
Table 33: Essential Oils Market By Application, Revenue & Volume, By Medical, 2023-2030 ($)
Table 34: Essential Oils Market By Application, Revenue & Volume, By Food & Beverage, 2023-2030 ($)
Table 35: Essential Oils Market By Application, Revenue & Volume, By Spa & Relaxation, 2023-2030 ($)
Table 36: Essential Oils Market By Application, Revenue & Volume, By Cleaning & Home, 2023-2030 ($)
Table 37: North America Essential Oils Market, Revenue & Volume, By Product, 2023-2030 ($)
Table 38: North America Essential Oils Market, Revenue & Volume, By Application, 2023-2030 ($)
Table 39: South america Essential Oils Market, Revenue & Volume, By Product, 2023-2030 ($)
Table 40: South america Essential Oils Market, Revenue & Volume, By Application, 2023-2030 ($)
Table 41: Europe Essential Oils Market, Revenue & Volume, By Product, 2023-2030 ($)
Table 42: Europe Essential Oils Market, Revenue & Volume, By Application, 2023-2030 ($)
Table 43: APAC Essential Oils Market, Revenue & Volume, By Product, 2023-2030 ($)
Table 44: APAC Essential Oils Market, Revenue & Volume, By Application, 2023-2030 ($)
Table 45: Middle East & Africa Essential Oils Market, Revenue & Volume, By Product, 2023-2030 ($)
Table 46: Middle East & Africa Essential Oils Market, Revenue & Volume, By Application, 2023-2030 ($)
Table 47: Russia Essential Oils Market, Revenue & Volume, By Product, 2023-2030 ($)
Table 48: Russia Essential Oils Market, Revenue & Volume, By Application, 2023-2030 ($)
Table 49: Israel Essential Oils Market, Revenue & Volume, By Product, 2023-2030 ($)
Table 50: Israel Essential Oils Market, Revenue & Volume, By Application, 2023-2030 ($)
Table 51: Top Companies 2023 (US$)Essential Oils Market, Revenue & Volume
Table 52: Product Launch 2023-2030Essential Oils Market, Revenue & Volume
Table 53: Mergers & Acquistions 2023-2030Essential Oils Market, Revenue & Volume
List of Figures
Figure 1: Overview of Essential Oils Market 2023-2030
Figure 2: Market Share Analysis for Essential Oils Market 2023 (US$)
Figure 3: Product Comparison in Essential Oils Market 2023-2030 (US$)
Figure 4: End User Profile for Essential Oils Market 2023-2030 (US$)
Figure 5: Patent Application and Grant in Essential Oils Market 2013-2023* (US$)
Figure 6: Top 5 Companies Financial Analysis in Essential Oils Market 2023-2030 (US$)
Figure 7: Market Entry Strategy in Essential Oils Market 2023-2030
Figure 8: Ecosystem Analysis in Essential Oils Market 2023
Figure 9: Average Selling Price in Essential Oils Market 2023-2030
Figure 10: Top Opportunites in Essential Oils Market 2023-2030
Figure 11: Market Life Cycle Analysis in Essential Oils Market
Figure 12: GlobalBy ProductEssential Oils Market Revenue, 2023-2030 ($)
Figure 13: GlobalBy ApplicationEssential Oils Market Revenue, 2023-2030 ($)
Figure 14: Global Essential Oils Market - By Geography
Figure 15: Global Essential Oils Market Value & Volume, By Geography, 2023-2030 ($)
Figure 16: Global Essential Oils Market CAGR, By Geography, 2023-2030 (%)
Figure 17: North America Essential Oils Market Value & Volume, 2023-2030 ($)
Figure 18: US Essential Oils Market Value & Volume, 2023-2030 ($)
Figure 19: US GDP and Population, 2023-2030 ($)
Figure 20: US GDP – Composition of 2023, By Sector of Origin
Figure 21: US Export and Import Value & Volume, 2023-2030 ($)
Figure 22: Canada Essential Oils Market Value & Volume, 2023-2030 ($)
Figure 23: Canada GDP and Population, 2023-2030 ($)
Figure 24: Canada GDP – Composition of 2023, By Sector of Origin
Figure 25: Canada Export and Import Value & Volume, 2023-2030 ($)
Figure 26: Mexico Essential Oils Market Value & Volume, 2023-2030 ($)
Figure 27: Mexico GDP and Population, 2023-2030 ($)
Figure 28: Mexico GDP – Composition of 2023, By Sector of Origin
Figure 29: Mexico Export and Import Value & Volume, 2023-2030 ($)
Figure 30: South America Essential Oils Market Value & Volume, 2023-2030 ($)
Figure 31: Brazil Essential Oils Market Value & Volume, 2023-2030 ($)
Figure 32: Brazil GDP and Population, 2023-2030 ($)
Figure 33: Brazil GDP – Composition of 2023, By Sector of Origin
Figure 34: Brazil Export and Import Value & Volume, 2023-2030 ($)
Figure 35: Venezuela Essential Oils Market Value & Volume, 2023-2030 ($)
Figure 36: Venezuela GDP and Population, 2023-2030 ($)
Figure 37: Venezuela GDP – Composition of 2023, By Sector of Origin
Figure 38: Venezuela Export and Import Value & Volume, 2023-2030 ($)
Figure 39: Argentina Essential Oils Market Value & Volume, 2023-2030 ($)
Figure 40: Argentina GDP and Population, 2023-2030 ($)
Figure 41: Argentina GDP – Composition of 2023, By Sector of Origin
Figure 42: Argentina Export and Import Value & Volume, 2023-2030 ($)
Figure 43: Ecuador Essential Oils Market Value & Volume, 2023-2030 ($)
Figure 44: Ecuador GDP and Population, 2023-2030 ($)
Figure 45: Ecuador GDP – Composition of 2023, By Sector of Origin
Figure 46: Ecuador Export and Import Value & Volume, 2023-2030 ($)
Figure 47: Peru Essential Oils Market Value & Volume, 2023-2030 ($)
Figure 48: Peru GDP and Population, 2023-2030 ($)
Figure 49: Peru GDP – Composition of 2023, By Sector of Origin
Figure 50: Peru Export and Import Value & Volume, 2023-2030 ($)
Figure 51: Colombia Essential Oils Market Value & Volume, 2023-2030 ($)
Figure 52: Colombia GDP and Population, 2023-2030 ($)
Figure 53: Colombia GDP – Composition of 2023, By Sector of Origin
Figure 54: Colombia Export and Import Value & Volume, 2023-2030 ($)
Figure 55: Costa Rica Essential Oils Market Value & Volume, 2023-2030 ($)
Figure 56: Costa Rica GDP and Population, 2023-2030 ($)
Figure 57: Costa Rica GDP – Composition of 2023, By Sector of Origin
Figure 58: Costa Rica Export and Import Value & Volume, 2023-2030 ($)
Figure 59: Europe Essential Oils Market Value & Volume, 2023-2030 ($)
Figure 60: U.K Essential Oils Market Value & Volume, 2023-2030 ($)
Figure 61: U.K GDP and Population, 2023-2030 ($)
Figure 62: U.K GDP – Composition of 2023, By Sector of Origin
Figure 63: U.K Export and Import Value & Volume, 2023-2030 ($)
Figure 64: Germany Essential Oils Market Value & Volume, 2023-2030 ($)
Figure 65: Germany GDP and Population, 2023-2030 ($)
Figure 66: Germany GDP – Composition of 2023, By Sector of Origin
Figure 67: Germany Export and Import Value & Volume, 2023-2030 ($)
Figure 68: Italy Essential Oils Market Value & Volume, 2023-2030 ($)
Figure 69: Italy GDP and Population, 2023-2030 ($)
Figure 70: Italy GDP – Composition of 2023, By Sector of Origin
Figure 71: Italy Export and Import Value & Volume, 2023-2030 ($)
Figure 72: France Essential Oils Market Value & Volume, 2023-2030 ($)
Figure 73: France GDP and Population, 2023-2030 ($)
Figure 74: France GDP – Composition of 2023, By Sector of Origin
Figure 75: France Export and Import Value & Volume, 2023-2030 ($)
Figure 76: Netherlands Essential Oils Market Value & Volume, 2023-2030 ($)
Figure 77: Netherlands GDP and Population, 2023-2030 ($)
Figure 78: Netherlands GDP – Composition of 2023, By Sector of Origin
Figure 79: Netherlands Export and Import Value & Volume, 2023-2030 ($)
Figure 80: Belgium Essential Oils Market Value & Volume, 2023-2030 ($)
Figure 81: Belgium GDP and Population, 2023-2030 ($)
Figure 82: Belgium GDP – Composition of 2023, By Sector of Origin
Figure 83: Belgium Export and Import Value & Volume, 2023-2030 ($)
Figure 84: Spain Essential Oils Market Value & Volume, 2023-2030 ($)
Figure 85: Spain GDP and Population, 2023-2030 ($)
Figure 86: Spain GDP – Composition of 2023, By Sector of Origin
Figure 87: Spain Export and Import Value & Volume, 2023-2030 ($)
Figure 88: Denmark Essential Oils Market Value & Volume, 2023-2030 ($)
Figure 89: Denmark GDP and Population, 2023-2030 ($)
Figure 90: Denmark GDP – Composition of 2023, By Sector of Origin
Figure 91: Denmark Export and Import Value & Volume, 2023-2030 ($)
Figure 92: APAC Essential Oils Market Value & Volume, 2023-2030 ($)
Figure 93: China Essential Oils Market Value & Volume, 2023-2030
Figure 94: China GDP and Population, 2023-2030 ($)
Figure 95: China GDP – Composition of 2023, By Sector of Origin
Figure 96: China Export and Import Value & Volume, 2023-2030 ($)Essential Oils Market China Export and Import Value & Volume, 2023-2030 ($)
Figure 97: Australia Essential Oils Market Value & Volume, 2023-2030 ($)
Figure 98: Australia GDP and Population, 2023-2030 ($)
Figure 99: Australia GDP – Composition of 2023, By Sector of Origin
Figure 100: Australia Export and Import Value & Volume, 2023-2030 ($)
Figure 101: South Korea Essential Oils Market Value & Volume, 2023-2030 ($)
Figure 102: South Korea GDP and Population, 2023-2030 ($)
Figure 103: South Korea GDP – Composition of 2023, By Sector of Origin
Figure 104: South Korea Export and Import Value & Volume, 2023-2030 ($)
Figure 105: India Essential Oils Market Value & Volume, 2023-2030 ($)
Figure 106: India GDP and Population, 2023-2030 ($)
Figure 107: India GDP – Composition of 2023, By Sector of Origin
Figure 108: India Export and Import Value & Volume, 2023-2030 ($)
Figure 109: Taiwan Essential Oils Market Value & Volume, 2023-2030 ($)
Figure 110: Taiwan GDP and Population, 2023-2030 ($)
Figure 111: Taiwan GDP – Composition of 2023, By Sector of Origin
Figure 112: Taiwan Export and Import Value & Volume, 2023-2030 ($)
Figure 113: Malaysia Essential Oils Market Value & Volume, 2023-2030 ($)
Figure 114: Malaysia GDP and Population, 2023-2030 ($)
Figure 115: Malaysia GDP – Composition of 2023, By Sector of Origin
Figure 116: Malaysia Export and Import Value & Volume, 2023-2030 ($)
Figure 117: Hong Kong Essential Oils Market Value & Volume, 2023-2030 ($)
Figure 118: Hong Kong GDP and Population, 2023-2030 ($)
Figure 119: Hong Kong GDP – Composition of 2023, By Sector of Origin
Figure 120: Hong Kong Export and Import Value & Volume, 2023-2030 ($)
Figure 121: Middle East & Africa Essential Oils Market Middle East & Africa 3D Printing Market Value & Volume, 2023-2030 ($)
Figure 122: Russia Essential Oils Market Value & Volume, 2023-2030 ($)
Figure 123: Russia GDP and Population, 2023-2030 ($)
Figure 124: Russia GDP – Composition of 2023, By Sector of Origin
Figure 125: Russia Export and Import Value & Volume, 2023-2030 ($)
Figure 126: Israel Essential Oils Market Value & Volume, 2023-2030 ($)
Figure 127: Israel GDP and Population, 2023-2030 ($)
Figure 128: Israel GDP – Composition of 2023, By Sector of Origin
Figure 129: Israel Export and Import Value & Volume, 2023-2030 ($)
Figure 130: Entropy Share, By Strategies, 2023-2030* (%)Essential Oils Market
Figure 131: Developments, 2023-2030*Essential Oils Market
Figure 132: Company 1 Essential Oils Market Net Revenue, By Years, 2023-2030* ($)
Figure 133: Company 1 Essential Oils Market Net Revenue Share, By Business segments, 2023 (%)
Figure 134: Company 1 Essential Oils Market Net Sales Share, By Geography, 2023 (%)
Figure 135: Company 2 Essential Oils Market Net Revenue, By Years, 2023-2030* ($)
Figure 136: Company 2 Essential Oils Market Net Revenue Share, By Business segments, 2023 (%)
Figure 137: Company 2 Essential Oils Market Net Sales Share, By Geography, 2023 (%)
Figure 138: Company 3 Essential Oils Market Net Revenue, By Years, 2023-2030* ($)
Figure 139: Company 3 Essential Oils Market Net Revenue Share, By Business segments, 2023 (%)
Figure 140: Company 3 Essential Oils Market Net Sales Share, By Geography, 2023 (%)
Figure 141: Company 4 Essential Oils Market Net Revenue, By Years, 2023-2030* ($)
Figure 142: Company 4 Essential Oils Market Net Revenue Share, By Business segments, 2023 (%)
Figure 143: Company 4 Essential Oils Market Net Sales Share, By Geography, 2023 (%)
Figure 144: Company 5 Essential Oils Market Net Revenue, By Years, 2023-2030* ($)
Figure 145: Company 5 Essential Oils Market Net Revenue Share, By Business segments, 2023 (%)
Figure 146: Company 5 Essential Oils Market Net Sales Share, By Geography, 2023 (%)
Figure 147: Company 6 Essential Oils Market Net Revenue, By Years, 2023-2030* ($)
Figure 148: Company 6 Essential Oils Market Net Revenue Share, By Business segments, 2023 (%)
Figure 149: Company 6 Essential Oils Market Net Sales Share, By Geography, 2023 (%)
Figure 150: Company 7 Essential Oils Market Net Revenue, By Years, 2023-2030* ($)
Figure 151: Company 7 Essential Oils Market Net Revenue Share, By Business segments, 2023 (%)
Figure 152: Company 7 Essential Oils Market Net Sales Share, By Geography, 2023 (%)
Figure 153: Company 8 Essential Oils Market Net Revenue, By Years, 2023-2030* ($)
Figure 154: Company 8 Essential Oils Market Net Revenue Share, By Business segments, 2023 (%)
Figure 155: Company 8 Essential Oils Market Net Sales Share, By Geography, 2023 (%)
Figure 156: Company 9 Essential Oils Market Net Revenue, By Years, 2023-2030* ($)
Figure 157: Company 9 Essential Oils Market Net Revenue Share, By Business segments, 2023 (%)
Figure 158: Company 9 Essential Oils Market Net Sales Share, By Geography, 2023 (%)
Figure 159: Company 10 Essential Oils Market Net Revenue, By Years, 2023-2030* ($)
Figure 160: Company 10 Essential Oils Market Net Revenue Share, By Business segments, 2023 (%)
Figure 161: Company 10 Essential Oils Market Net Sales Share, By Geography, 2023 (%)
Figure 162: Company 11 Essential Oils Market Net Revenue, By Years, 2023-2030* ($)
Figure 163: Company 11 Essential Oils Market Net Revenue Share, By Business segments, 2023 (%)
Figure 164: Company 11 Essential Oils Market Net Sales Share, By Geography, 2023 (%)
Figure 165: Company 12 Essential Oils Market Net Revenue, By Years, 2023-2030* ($)
Figure 166: Company 12 Essential Oils Market Net Revenue Share, By Business segments, 2023 (%)
Figure 167: Company 12 Essential Oils Market Net Sales Share, By Geography, 2023 (%)
Figure 168: Company 13 Essential Oils Market Net Revenue, By Years, 2023-2030* ($)
Figure 169: Company 13 Essential Oils Market Net Revenue Share, By Business segments, 2023 (%)
Figure 170: Company 13 Essential Oils Market Net Sales Share, By Geography, 2023 (%)
Figure 171: Company 14 Essential Oils Market Net Revenue, By Years, 2023-2030* ($)
Figure 172: Company 14 Essential Oils Market Net Revenue Share, By Business segments, 2023 (%)
Figure 173: Company 14 Essential Oils Market Net Sales Share, By Geography, 2023 (%)
Figure 174: Company 15 Essential Oils Market Net Revenue, By Years, 2023-2030* ($)
Figure 175: Company 15 Essential Oils Market Net Revenue Share, By Business segments, 2023 (%)
Figure 176: Company 15 Essential Oils Market Net Sales Share, By Geography, 2023 (%)