 Email
Email Print
Print


Diabetic Macular Edema Market- By Type ; By Treatment Categories ; By Geography (Americas, Europe, Asia-Pacific) - Forecast(2024 - 2030)
The report “Global Diabetic Macular Edema Market” for the projected period 2016 to 2021 has been segmented on three different parameters. The global DME market has been primarily studied on the basis of different categories of Diabetic Macular Edema as per the Optical Coherence Tomography (OCT ) classification that are Spongiform DME, Cystoid Macular Edema and so on. The Diabetic Macular Edema market has also been studied on the basis of different treatment methods such as Anti-angiogenic drugs injection, Laser treatment and many more. The market has also been studied on the basis of different geographies and the level of population affected by the Diabetic Macular Edema disease in those geographies.
As per the study conducted by International Diabetes Federation (IDF), approximately 284 million people, almost equivalent to half of the European population are suffering from visually impairments out of which 39 million of them are totally blind. These kinds of diseases in addition to the human aspects also carry significant social as well as economic impact. Medical organizations and pharmaceuticals companies are investing substantially into R&D, infrastructure and technology to tackle the burden of these chronic diseases. DME only affects a certain percentage of diabetic patients; its percentage is likely to grow in the coming years. The number of people suffering from diabetes in Europe is speculated to rise from 55.2 million in 2010 to 66.2 million by 2030, DME cases would increase proportionately. There are several anti VEGF compounds which are being manufactured and currently into research phase. Asia-Pacific region is expected to be one of the emerging markets for DME treatment, as the diabetic population in the developing nations such as India, China and Indonesia are pacing up exponentially.
Sample Companies Profiled in this Report are:
- Allergan PLC
- Clearside Biomedical, Inc.
- Novartis AG
- Valeant Pharmaceuticals (Bausch & Lomb)
- Regenron PLC
- 10+
T0he Diabetic Macular Edema market report also comprises of the leading companies profiled in an extremely descriptive manner. The company profiles include financial summaries, strategies, recent developments and product portfolios of the leading companies in the Diabetic Macular Edema market. The report also incorporates a profound study of the market entropy, market forces and strategic analysis of the Diabetic Macular Edema market.
List of Tables:
Table1: Diabetic Macular Edema Market Overview 2023-2030
Table2: Diabetic Macular Edema Market Leader Analysis 2023-2030 (US$)
Table3: Diabetic Macular Edema Market Product Analysis 2023-2030 (US$)
Table4: Diabetic Macular Edema Market End User Analysis 2023-2030 (US$)
Table5: Diabetic Macular Edema Market Patent Analysis 2013-2023* (US$)
Table6: Diabetic Macular Edema Market Financial Analysis 2023-2030 (US$)
Table7: Diabetic Macular Edema Market Driver Analysis 2023-2030 (US$)
Table8: Diabetic Macular Edema Market Challenges Analysis 2023-2030 (US$)
Table9: Diabetic Macular Edema Market Constraint Analysis 2023-2030 (US$)
Table10: Diabetic Macular Edema Market Supplier Bargaining Power Analysis 2023-2030 (US$)
Table11: Diabetic Macular Edema Market Buyer Bargaining Power Analysis 2023-2030 (US$)
Table12: Diabetic Macular Edema Market Threat of Substitutes Analysis 2023-2030 (US$)
Table13: Diabetic Macular Edema Market Threat of New Entrants Analysis 2023-2030 (US$)
Table14: Diabetic Macular Edema Market Degree of Competition Analysis 2023-2030 (US$)
Table15: Diabetic Macular Edema Market Value Chain Analysis 2023-2030 (US$)
Table16: Diabetic Macular Edema Market Pricing Analysis 2023-2030 (US$)
Table17: Diabetic Macular Edema Market Opportunities Analysis 2023-2030 (US$)
Table18: Diabetic Macular Edema Market Product Life Cycle Analysis 2023-2030 (US$)
Table19: Diabetic Macular Edema Market Supplier Analysis 2023-2030 (US$)
Table20: Diabetic Macular Edema Market Distributor Analysis 2023-2030 (US$)
Table21: Diabetic Macular Edema Market Trend Analysis 2023-2030 (US$)
Table22: Diabetic Macular Edema Market Size 2023 (US$)
Table23: Diabetic Macular Edema Market Forecast Analysis 2023-2030 (US$)
Table24: Diabetic Macular Edema Market Sales Forecast Analysis 2023-2030 (Units)
Table25: Diabetic Macular Edema Market, Revenue & Volume, By Type, 2023-2030 ($)
Table26: Diabetic Macular Edema Market By Type, Revenue & Volume, By Spongiform, 2023-2030 ($)
Table27: Diabetic Macular Edema Market By Type, Revenue & Volume, By Diffuse Macular Edema, 2023-2030 ($)
Table28: Diabetic Macular Edema Market By Type, Revenue & Volume, By Cystoid Macular Edema, 2023-2030 ($)
Table29: Diabetic Macular Edema Market By Type, Revenue & Volume, By Serous Retinal Detachment, 2023-2030 ($)
Table30: Diabetic Macular Edema Market By Type, Revenue & Volume, By Tractional, 2023-2030 ($)
Table31: Diabetic Macular Edema Market, Revenue & Volume, By Treatment Methods, 2023-2030 ($)
Table32: Diabetic Macular Edema Market By Treatment Methods, Revenue & Volume, By Laser Treatment, 2023-2030 ($)
Table33: Diabetic Macular Edema Market By Treatment Methods, Revenue & Volume, By Anti-angiogenic Drugs Injection, 2023-2030 ($)
Table34: Diabetic Macular Edema Market By Treatment Methods, Revenue & Volume, By Intravitreal Steriods, 2023-2030 ($)
Table35: Diabetic Macular Edema Market By Treatment Methods, Revenue & Volume, By Anti–vascular Endothelial Growth Factor (VEGF) Therapy, 2023-2030 ($)
Table36: North America Diabetic Macular Edema Market, Revenue & Volume, By Type, 2023-2030 ($)
Table37: North America Diabetic Macular Edema Market, Revenue & Volume, By Treatment Methods, 2023-2030 ($)
Table38: South america Diabetic Macular Edema Market, Revenue & Volume, By Type, 2023-2030 ($)
Table39: South america Diabetic Macular Edema Market, Revenue & Volume, By Treatment Methods, 2023-2030 ($)
Table40: Europe Diabetic Macular Edema Market, Revenue & Volume, By Type, 2023-2030 ($)
Table41: Europe Diabetic Macular Edema Market, Revenue & Volume, By Treatment Methods, 2023-2030 ($)
Table42: APAC Diabetic Macular Edema Market, Revenue & Volume, By Type, 2023-2030 ($)
Table43: APAC Diabetic Macular Edema Market, Revenue & Volume, By Treatment Methods, 2023-2030 ($)
Table44: Middle East & Africa Diabetic Macular Edema Market, Revenue & Volume, By Type, 2023-2030 ($)
Table45: Middle East & Africa Diabetic Macular Edema Market, Revenue & Volume, By Treatment Methods, 2023-2030 ($)
Table46: Russia Diabetic Macular Edema Market, Revenue & Volume, By Type, 2023-2030 ($)
Table47: Russia Diabetic Macular Edema Market, Revenue & Volume, By Treatment Methods, 2023-2030 ($)
Table48: Israel Diabetic Macular Edema Market, Revenue & Volume, By Type, 2023-2030 ($)
Table49: Israel Diabetic Macular Edema Market, Revenue & Volume, By Treatment Methods, 2023-2030 ($)
Table50: Top Companies 2023 (US$)Diabetic Macular Edema Market, Revenue & Volume
Table51: Product Launch 2023-2030Diabetic Macular Edema Market, Revenue & Volume
Table52: Mergers & Acquistions 2023-2030Diabetic Macular Edema Market, Revenue & Volume
List of Figures:
Figure 1: Overview of Diabetic Macular Edema Market 2023-2030
Figure 2: Market Share Analysis for Diabetic Macular Edema Market 2023 (US$)
Figure 3: Product Comparison in Diabetic Macular Edema Market 2023-2030 (US$)
Figure 4: End User Profile for Diabetic Macular Edema Market 2023-2030 (US$)
Figure 5: Patent Application and Grant in Diabetic Macular Edema Market 2013-2023* (US$)
Figure 6: Top 5 Companies Financial Analysis in Diabetic Macular Edema Market 2023-2030 (US$)
Figure 7: Market Entry Strategy in Diabetic Macular Edema Market 2023-2030
Figure 8: Ecosystem Analysis in Diabetic Macular Edema Market 2023
Figure 9: Average Selling Price in Diabetic Macular Edema Market 2023-2030
Figure 10: Top Opportunites in Diabetic Macular Edema Market 2023-2030
Figure 11: Market Life Cycle Analysis in Diabetic Macular Edema Market
Figure 12: GlobalBy TypeDiabetic Macular Edema Market Revenue, 2023-2030 ($)
Figure 13: GlobalBy Treatment MethodsDiabetic Macular Edema Market Revenue, 2023-2030 ($)
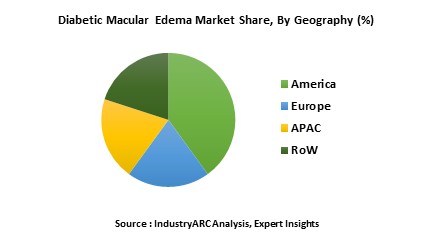
Figure 14: Global Diabetic Macular Edema Market - By Geography
Figure 15: Global Diabetic Macular Edema Market Value & Volume, By Geography, 2023-2030 ($)
Figure 16: Global Diabetic Macular Edema Market CAGR, By Geography, 2023-2030 (%)
Figure 17: North America Diabetic Macular Edema Market Value & Volume, 2023-2030 ($)
Figure 18: US Diabetic Macular Edema Market Value & Volume, 2023-2030 ($)
Figure 19: US GDP and Population, 2023-2030 ($)
Figure 20: US GDP – Composition of 2023, By Sector of Origin
Figure 21: US Export and Import Value & Volume, 2023-2030 ($)
Figure 22: Canada Diabetic Macular Edema Market Value & Volume, 2023-2030 ($)
Figure 23: Canada GDP and Population, 2023-2030 ($)
Figure 24: Canada GDP – Composition of 2023, By Sector of Origin
Figure 25: Canada Export and Import Value & Volume, 2023-2030 ($)
Figure 26: Mexico Diabetic Macular Edema Market Value & Volume, 2023-2030 ($)
Figure 27: Mexico GDP and Population, 2023-2030 ($)
Figure 28: Mexico GDP – Composition of 2023, By Sector of Origin
Figure 29: Mexico Export and Import Value & Volume, 2023-2030 ($)
Figure 30: South America Diabetic Macular Edema Market Value & Volume, 2023-2030 ($)
Figure 31: Brazil Diabetic Macular Edema Market Value & Volume, 2023-2030 ($)
Figure 32: Brazil GDP and Population, 2023-2030 ($)
Figure 33: Brazil GDP – Composition of 2023, By Sector of Origin
Figure 34: Brazil Export and Import Value & Volume, 2023-2030 ($)
Figure 35: Venezuela Diabetic Macular Edema Market Value & Volume, 2023-2030 ($)
Figure 36: Venezuela GDP and Population, 2023-2030 ($)
Figure 37: Venezuela GDP – Composition of 2023, By Sector of Origin
Figure 38: Venezuela Export and Import Value & Volume, 2023-2030 ($)
Figure 39: Argentina Diabetic Macular Edema Market Value & Volume, 2023-2030 ($)
Figure 40: Argentina GDP and Population, 2023-2030 ($)
Figure 41: Argentina GDP – Composition of 2023, By Sector of Origin
Figure 42: Argentina Export and Import Value & Volume, 2023-2030 ($)
Figure 43: Ecuador Diabetic Macular Edema Market Value & Volume, 2023-2030 ($)
Figure 44: Ecuador GDP and Population, 2023-2030 ($)
Figure 45: Ecuador GDP – Composition of 2023, By Sector of Origin
Figure 46: Ecuador Export and Import Value & Volume, 2023-2030 ($)
Figure 47: Peru Diabetic Macular Edema Market Value & Volume, 2023-2030 ($)
Figure 48: Peru GDP and Population, 2023-2030 ($)
Figure 49: Peru GDP – Composition of 2023, By Sector of Origin
Figure 50: Peru Export and Import Value & Volume, 2023-2030 ($)
Figure 51: Colombia Diabetic Macular Edema Market Value & Volume, 2023-2030 ($)
Figure 52: Colombia GDP and Population, 2023-2030 ($)
Figure 53: Colombia GDP – Composition of 2023, By Sector of Origin
Figure 54: Colombia Export and Import Value & Volume, 2023-2030 ($)
Figure 55: Costa Rica Diabetic Macular Edema Market Value & Volume, 2023-2030 ($)
Figure 56: Costa Rica GDP and Population, 2023-2030 ($)
Figure 57: Costa Rica GDP – Composition of 2023, By Sector of Origin
Figure 58: Costa Rica Export and Import Value & Volume, 2023-2030 ($)
Figure 59: Europe Diabetic Macular Edema Market Value & Volume, 2023-2030 ($)
Figure 60: U.K Diabetic Macular Edema Market Value & Volume, 2023-2030 ($)
Figure 61: U.K GDP and Population, 2023-2030 ($)
Figure 62: U.K GDP – Composition of 2023, By Sector of Origin
Figure 63: U.K Export and Import Value & Volume, 2023-2030 ($)
Figure 64: Germany Diabetic Macular Edema Market Value & Volume, 2023-2030 ($)
Figure 65: Germany GDP and Population, 2023-2030 ($)
Figure 66: Germany GDP – Composition of 2023, By Sector of Origin
Figure 67: Germany Export and Import Value & Volume, 2023-2030 ($)
Figure 68: Italy Diabetic Macular Edema Market Value & Volume, 2023-2030 ($)
Figure 69: Italy GDP and Population, 2023-2030 ($)
Figure 70: Italy GDP – Composition of 2023, By Sector of Origin
Figure 71: Italy Export and Import Value & Volume, 2023-2030 ($)
Figure 72: France Diabetic Macular Edema Market Value & Volume, 2023-2030 ($)
Figure 73: France GDP and Population, 2023-2030 ($)
Figure 74: France GDP – Composition of 2023, By Sector of Origin
Figure 75: France Export and Import Value & Volume, 2023-2030 ($)
Figure 76: Netherlands Diabetic Macular Edema Market Value & Volume, 2023-2030 ($)
Figure 77: Netherlands GDP and Population, 2023-2030 ($)
Figure 78: Netherlands GDP – Composition of 2023, By Sector of Origin
Figure 79: Netherlands Export and Import Value & Volume, 2023-2030 ($)
Figure 80: Belgium Diabetic Macular Edema Market Value & Volume, 2023-2030 ($)
Figure 81: Belgium GDP and Population, 2023-2030 ($)
Figure 82: Belgium GDP – Composition of 2023, By Sector of Origin
Figure 83: Belgium Export and Import Value & Volume, 2023-2030 ($)
Figure 84: Spain Diabetic Macular Edema Market Value & Volume, 2023-2030 ($)
Figure 85: Spain GDP and Population, 2023-2030 ($)
Figure 86: Spain GDP – Composition of 2023, By Sector of Origin
Figure 87: Spain Export and Import Value & Volume, 2023-2030 ($)
Figure 88: Denmark Diabetic Macular Edema Market Value & Volume, 2023-2030 ($)
Figure 89: Denmark GDP and Population, 2023-2030 ($)
Figure 90: Denmark GDP – Composition of 2023, By Sector of Origin
Figure 91: Denmark Export and Import Value & Volume, 2023-2030 ($)
Figure 92: APAC Diabetic Macular Edema Market Value & Volume, 2023-2030 ($)
Figure 93: China Diabetic Macular Edema Market Value & Volume, 2023-2030
Figure 94: China GDP and Population, 2023-2030 ($)
Figure 95: China GDP – Composition of 2023, By Sector of Origin
Figure 96: China Export and Import Value & Volume, 2023-2030 ($)Diabetic Macular Edema Market China Export and Import Value & Volume, 2023-2030 ($)
Figure 97: Australia Diabetic Macular Edema Market Value & Volume, 2023-2030 ($)
Figure 98: Australia GDP and Population, 2023-2030 ($)
Figure 99: Australia GDP – Composition of 2023, By Sector of Origin
Figure 100: Australia Export and Import Value & Volume, 2023-2030 ($)
Figure 101: South Korea Diabetic Macular Edema Market Value & Volume, 2023-2030 ($)
Figure 102: South Korea GDP and Population, 2023-2030 ($)
Figure 103: South Korea GDP – Composition of 2023, By Sector of Origin
Figure 104: South Korea Export and Import Value & Volume, 2023-2030 ($)
Figure 105: India Diabetic Macular Edema Market Value & Volume, 2023-2030 ($)
Figure 106: India GDP and Population, 2023-2030 ($)
Figure 107: India GDP – Composition of 2023, By Sector of Origin
Figure 108: India Export and Import Value & Volume, 2023-2030 ($)
Figure 109: Taiwan Diabetic Macular Edema Market Value & Volume, 2023-2030 ($)
Figure 110: Taiwan GDP and Population, 2023-2030 ($)
Figure 111: Taiwan GDP – Composition of 2023, By Sector of Origin
Figure 112: Taiwan Export and Import Value & Volume, 2023-2030 ($)
Figure 113: Malaysia Diabetic Macular Edema Market Value & Volume, 2023-2030 ($)
Figure 114: Malaysia GDP and Population, 2023-2030 ($)
Figure 115: Malaysia GDP – Composition of 2023, By Sector of Origin
Figure 116: Malaysia Export and Import Value & Volume, 2023-2030 ($)
Figure 117: Hong Kong Diabetic Macular Edema Market Value & Volume, 2023-2030 ($)
Figure 118: Hong Kong GDP and Population, 2023-2030 ($)
Figure 119: Hong Kong GDP – Composition of 2023, By Sector of Origin
Figure 120: Hong Kong Export and Import Value & Volume, 2023-2030 ($)
Figure 121: Middle East & Africa Diabetic Macular Edema Market Middle East & Africa 3D Printing Market Value & Volume, 2023-2030 ($)
Figure 122: Russia Diabetic Macular Edema Market Value & Volume, 2023-2030 ($)
Figure 123: Russia GDP and Population, 2023-2030 ($)
Figure 124: Russia GDP – Composition of 2023, By Sector of Origin
Figure 125: Russia Export and Import Value & Volume, 2023-2030 ($)
Figure 126: Israel Diabetic Macular Edema Market Value & Volume, 2023-2030 ($)
Figure 127: Israel GDP and Population, 2023-2030 ($)
Figure 128: Israel GDP – Composition of 2023, By Sector of Origin
Figure 129: Israel Export and Import Value & Volume, 2023-2030 ($)
Figure 130: Entropy Share, By Strategies, 2023-2030* (%)Diabetic Macular Edema Market
Figure 131: Developments, 2023-2030*Diabetic Macular Edema Market
Figure 132: Company 1 Diabetic Macular Edema Market Net Revenue, By Years, 2023-2030* ($)
Figure 133: Company 1 Diabetic Macular Edema Market Net Revenue Share, By Business segments, 2023 (%)
Figure 134: Company 1 Diabetic Macular Edema Market Net Sales Share, By Geography, 2023 (%)
Figure 135: Company 2 Diabetic Macular Edema Market Net Revenue, By Years, 2023-2030* ($)
Figure 136: Company 2 Diabetic Macular Edema Market Net Revenue Share, By Business segments, 2023 (%)
Figure 137: Company 2 Diabetic Macular Edema Market Net Sales Share, By Geography, 2023 (%)
Figure 138: Company 3 Diabetic Macular Edema Market Net Revenue, By Years, 2023-2030* ($)
Figure 139: Company 3 Diabetic Macular Edema Market Net Revenue Share, By Business segments, 2023 (%)
Figure 140: Company 3 Diabetic Macular Edema Market Net Sales Share, By Geography, 2023 (%)
Figure 141: Company 4 Diabetic Macular Edema Market Net Revenue, By Years, 2023-2030* ($)
Figure 142: Company 4 Diabetic Macular Edema Market Net Revenue Share, By Business segments, 2023 (%)
Figure 143: Company 4 Diabetic Macular Edema Market Net Sales Share, By Geography, 2023 (%)
Figure 144: Company 5 Diabetic Macular Edema Market Net Revenue, By Years, 2023-2030* ($)
Figure 145: Company 5 Diabetic Macular Edema Market Net Revenue Share, By Business segments, 2023 (%)
Figure 146: Company 5 Diabetic Macular Edema Market Net Sales Share, By Geography, 2023 (%)
Figure 147: Company 6 Diabetic Macular Edema Market Net Revenue, By Years, 2023-2030* ($)
Figure 148: Company 6 Diabetic Macular Edema Market Net Revenue Share, By Business segments, 2023 (%)
Figure 149: Company 6 Diabetic Macular Edema Market Net Sales Share, By Geography, 2023 (%)
Figure 150: Company 7 Diabetic Macular Edema Market Net Revenue, By Years, 2023-2030* ($)
Figure 151: Company 7 Diabetic Macular Edema Market Net Revenue Share, By Business segments, 2023 (%)
Figure 152: Company 7 Diabetic Macular Edema Market Net Sales Share, By Geography, 2023 (%)
Figure 153: Company 8 Diabetic Macular Edema Market Net Revenue, By Years, 2023-2030* ($)
Figure 154: Company 8 Diabetic Macular Edema Market Net Revenue Share, By Business segments, 2023 (%)
Figure 155: Company 8 Diabetic Macular Edema Market Net Sales Share, By Geography, 2023 (%)
Figure 156: Company 9 Diabetic Macular Edema Market Net Revenue, By Years, 2023-2030* ($)
Figure 157: Company 9 Diabetic Macular Edema Market Net Revenue Share, By Business segments, 2023 (%)
Figure 158: Company 9 Diabetic Macular Edema Market Net Sales Share, By Geography, 2023 (%)
Figure 159: Company 10 Diabetic Macular Edema Market Net Revenue, By Years, 2023-2030* ($)
Figure 160: Company 10 Diabetic Macular Edema Market Net Revenue Share, By Business segments, 2023 (%)
Figure 161: Company 10 Diabetic Macular Edema Market Net Sales Share, By Geography, 2023 (%)
Figure 162: Company 11 Diabetic Macular Edema Market Net Revenue, By Years, 2023-2030* ($)
Figure 163: Company 11 Diabetic Macular Edema Market Net Revenue Share, By Business segments, 2023 (%)
Figure 164: Company 11 Diabetic Macular Edema Market Net Sales Share, By Geography, 2023 (%)
Figure 165: Company 12 Diabetic Macular Edema Market Net Revenue, By Years, 2023-2030* ($)
Figure 166: Company 12 Diabetic Macular Edema Market Net Revenue Share, By Business segments, 2023 (%)
Figure 167: Company 12 Diabetic Macular Edema Market Net Sales Share, By Geography, 2023 (%)
Figure 168: Company 13 Diabetic Macular Edema Market Net Revenue, By Years, 2023-2030* ($)
Figure 169: Company 13 Diabetic Macular Edema Market Net Revenue Share, By Business segments, 2023 (%)
Figure 170: Company 13 Diabetic Macular Edema Market Net Sales Share, By Geography, 2023 (%)
Figure 171: Company 14 Diabetic Macular Edema Market Net Revenue, By Years, 2023-2030* ($)
Figure 172: Company 14 Diabetic Macular Edema Market Net Revenue Share, By Business segments, 2023 (%)
Figure 173: Company 14 Diabetic Macular Edema Market Net Sales Share, By Geography, 2023 (%)
Figure 174: Company 15 Diabetic Macular Edema Market Net Revenue, By Years, 2023-2030* ($)
Figure 175: Company 15 Diabetic Macular Edema Market Net Revenue Share, By Business segments, 2023 (%)
Figure 176: Company 15 Diabetic Macular Edema Market Net Sales Share, By Geography, 2023 (%)