List of Tables
Table 1 Flip Chip Market Overview 2023-2030
Table 2 Flip Chip Market Leader Analysis 2023-2030 (US$)
Table 3 Flip Chip Market Product Analysis 2023-2030 (US$)
Table 4 Flip Chip Market End User Analysis 2023-2030 (US$)
Table 5 Flip Chip Market Patent Analysis 2013-2023* (US$)
Table 6 Flip Chip Market Financial Analysis 2023-2030 (US$)
Table 7 Flip Chip Market Driver Analysis 2023-2030 (US$)
Table 8 Flip Chip Market Challenges Analysis 2023-2030 (US$)
Table 9 Flip Chip Market Constraint Analysis 2023-2030 (US$)
Table 10 Flip Chip Market Supplier Bargaining Power Analysis 2023-2030 (US$)
Table 11 Flip Chip Market Buyer Bargaining Power Analysis 2023-2030 (US$)
Table 12 Flip Chip Market Threat of Substitutes Analysis 2023-2030 (US$)
Table 13 Flip Chip Market Threat of New Entrants Analysis 2023-2030 (US$)
Table 14 Flip Chip Market Degree of Competition Analysis 2023-2030 (US$)
Table 15 Flip Chip Market Value Chain Analysis 2023-2030 (US$)
Table 16 Flip Chip Market Pricing Analysis 2023-2030 (US$)
Table 17 Flip Chip Market Opportunities Analysis 2023-2030 (US$)
Table 18 Flip Chip Market Product Life Cycle Analysis 2023-2030 (US$)
Table 19 Flip Chip Market Supplier Analysis 2023-2030 (US$)
Table 20 Flip Chip Market Distributor Analysis 2023-2030 (US$)
Table 21 Flip Chip Market Trend Analysis 2023-2030 (US$)
Table 22 Flip Chip Market Size 2023 (US$)
Table 23 Flip Chip Market Forecast Analysis 2023-2030 (US$)
Table 24 Flip Chip Market Sales Forecast Analysis 2023-2030 (Units)
Table 25 Flip Chip Market, Revenue & Volume,By Packaging type, 2023-2030 ($)
Table 26 Flip Chip Market By Packaging type, Revenue & Volume,By Flip Chip Ball Grid Array (fcBGA) Technology, 2023-2030 ($)
Table 27 Flip Chip Market By Packaging type, Revenue & Volume,By Flip Chip Chip Scale Package (fcCSP) Technology, 2023-2030 ($)
Table 28 Flip Chip Market By Packaging type, Revenue & Volume,By Wafer Level Packaging, 2023-2030 ($)
Table 29 Flip Chip Market By Packaging type, Revenue & Volume,By Others, 2023-2030 ($)
Table 30 Flip Chip Market, Revenue & Volume,By joining process, 2023-2030 ($)
Table 31 Flip Chip Market By joining process, Revenue & Volume,By Introduction, 2023-2030 ($)
Table 32 Flip Chip Market By joining process, Revenue & Volume,By Solder Joining, 2023-2030 ($)
Table 33 Flip Chip Market By joining process, Revenue & Volume,By Thermo Compression, 2023-2030 ($)
Table 34 Flip Chip Market By joining process, Revenue & Volume,By Thermo Sonic Joining, 2023-2030 ($)
Table 35 Flip Chip Market By joining process, Revenue & Volume,By Joining by Adhesive, 2023-2030 ($)
Table 36 Flip Chip Market, Revenue & Volume,By bumping process, 2023-2030 ($)
Table 37 Flip Chip Market By bumping process, Revenue & Volume,By Introduction, 2023-2030 ($)
Table 38 Flip Chip Market By bumping process, Revenue & Volume,By Copper (Cu) pillar, 2023-2030 ($)
Table 39 Flip Chip Market By bumping process, Revenue & Volume,By Lead (Pb) – free solder, 2023-2030 ($)
Table 40 Flip Chip Market By bumping process, Revenue & Volume,By Tin-Lead (Sn-Pb) eutectic solder, 2023-2030 ($)
Table 41 Flip Chip Market By bumping process, Revenue & Volume,By Gold stud and Plated solder, 2023-2030 ($)
Table 42 Flip Chip Market, Revenue & Volume,By Application, 2023-2030 ($)
Table 43 Flip Chip Market By Application, Revenue & Volume,By Introduction, 2023-2030 ($)
Table 44 Flip Chip Market By Application, Revenue & Volume,By 2D logic system-on-a-chip (SoC), 2023-2030 ($)
Table 45 Flip Chip Market By Application, Revenue & Volume,By Light Emitting Diode, 2023-2030 ($)
Table 46 Flip Chip Market By Application, Revenue & Volume,By Memory, 2023-2030 ($)
Table 47 Flip Chip Market By Application, Revenue & Volume,By Imaging, 2023-2030 ($)
Table 48 Flip Chip Market, Revenue & Volume,By End Use, 2023-2030 ($)
Table 49 Flip Chip Market By End Use, Revenue & Volume,By Introduction, 2023-2030 ($)
Table 50 Flip Chip Market By End Use, Revenue & Volume,By Telecommunications, 2023-2030 ($)
Table 51 Flip Chip Market By End Use, Revenue & Volume,By Consumer Electronics, 2023-2030 ($)
Table 52 Flip Chip Market By End Use, Revenue & Volume,By Automotive, 2023-2030 ($)
Table 53 Flip Chip Market By End Use, Revenue & Volume,By Industrial, 2023-2030 ($)
Table 54 North America Flip Chip Market, Revenue & Volume,By Packaging type, 2023-2030 ($)
Table 55 North America Flip Chip Market, Revenue & Volume,By joining process, 2023-2030 ($)
Table 56 North America Flip Chip Market, Revenue & Volume,By bumping process, 2023-2030 ($)
Table 57 North America Flip Chip Market, Revenue & Volume,By Application, 2023-2030 ($)
Table 58 North America Flip Chip Market, Revenue & Volume,By End Use, 2023-2030 ($)
Table 59 South america Flip Chip Market, Revenue & Volume,By Packaging type, 2023-2030 ($)
Table 60 South america Flip Chip Market, Revenue & Volume,By joining process, 2023-2030 ($)
Table 61 South america Flip Chip Market, Revenue & Volume,By bumping process, 2023-2030 ($)
Table 62 South america Flip Chip Market, Revenue & Volume,By Application, 2023-2030 ($)
Table 63 South america Flip Chip Market, Revenue & Volume,By End Use, 2023-2030 ($)
Table 64 Europe Flip Chip Market, Revenue & Volume,By Packaging type, 2023-2030 ($)
Table 65 Europe Flip Chip Market, Revenue & Volume,By joining process, 2023-2030 ($)
Table 66 Europe Flip Chip Market, Revenue & Volume,By bumping process, 2023-2030 ($)
Table 67 Europe Flip Chip Market, Revenue & Volume,By Application, 2023-2030 ($)
Table 68 Europe Flip Chip Market, Revenue & Volume,By End Use, 2023-2030 ($)
Table 69 APAC Flip Chip Market, Revenue & Volume,By Packaging type, 2023-2030 ($)
Table 70 APAC Flip Chip Market, Revenue & Volume,By joining process, 2023-2030 ($)
Table 71 APAC Flip Chip Market, Revenue & Volume,By bumping process, 2023-2030 ($)
Table 72 APAC Flip Chip Market, Revenue & Volume,By Application, 2023-2030 ($)
Table 73 APAC Flip Chip Market, Revenue & Volume,By End Use, 2023-2030 ($)
Table 74 Middle East & Africa Flip Chip Market, Revenue & Volume,By Packaging type, 2023-2030 ($)
Table 75 Middle East & Africa Flip Chip Market, Revenue & Volume,By joining process, 2023-2030 ($)
Table 76 Middle East & Africa Flip Chip Market, Revenue & Volume,By bumping process, 2023-2030 ($)
Table 77 Middle East & Africa Flip Chip Market, Revenue & Volume,By Application, 2023-2030 ($)
Table 78 Middle East & Africa Flip Chip Market, Revenue & Volume,By End Use, 2023-2030 ($)
Table 79 Russia Flip Chip Market, Revenue & Volume,By Packaging type, 2023-2030 ($)
Table 80 Russia Flip Chip Market, Revenue & Volume,By joining process, 2023-2030 ($)
Table 81 Russia Flip Chip Market, Revenue & Volume,By bumping process, 2023-2030 ($)
Table 82 Russia Flip Chip Market, Revenue & Volume,By Application, 2023-2030 ($)
Table 83 Russia Flip Chip Market, Revenue & Volume,By End Use, 2023-2030 ($)
Table 84 Israel Flip Chip Market, Revenue & Volume,By Packaging type, 2023-2030 ($)
Table 85 Israel Flip Chip Market, Revenue & Volume,By joining process, 2023-2030 ($)
Table 86 Israel Flip Chip Market, Revenue & Volume,By bumping process, 2023-2030 ($)
Table 87 Israel Flip Chip Market, Revenue & Volume,By Application, 2023-2030 ($)
Table 88 Israel Flip Chip Market, Revenue & Volume,By End Use, 2023-2030 ($)
Table 89 Top Companies 2023 (US$)Flip Chip Market, Revenue & Volume
Table 90 Product Launch 2023-2030Flip Chip Market, Revenue & Volume
Table 91 Mergers & Acquistions 2023-2030Flip Chip Market, Revenue & Volume
List of Figures
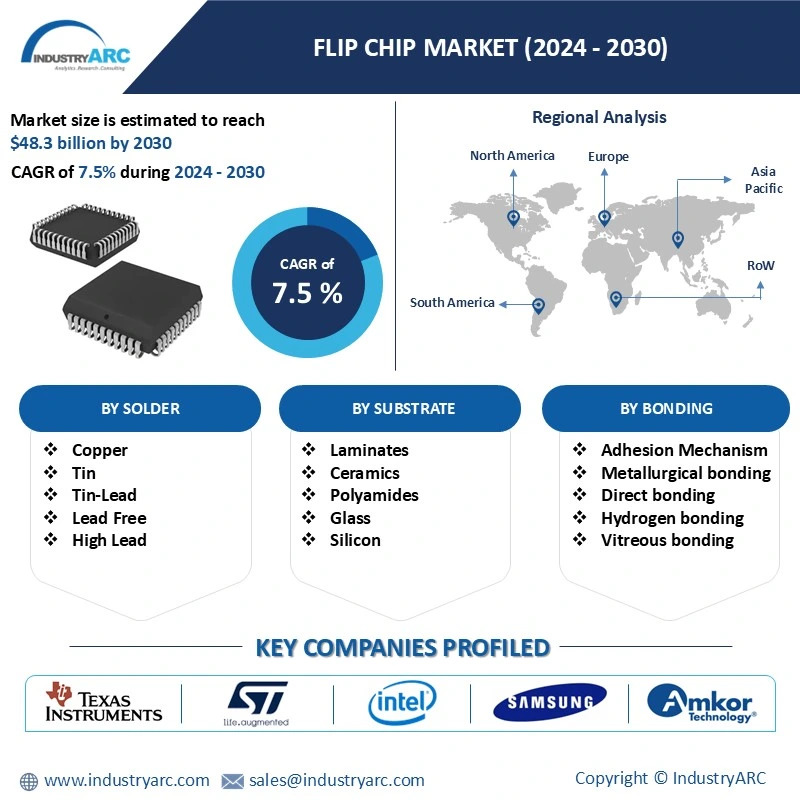
Figure 1 Overview of Flip Chip Market 2023-2030
Figure 2 Market Share Analysis for Flip Chip Market 2023 (US$)
Figure 3 Product Comparison in Flip Chip Market 2023-2030 (US$)
Figure 4 End User Profile for Flip Chip Market 2023-2030 (US$)
Figure 5 Patent Application and Grant in Flip Chip Market 2013-2023* (US$)
Figure 6 Top 5 Companies Financial Analysis in Flip Chip Market 2023-2030 (US$)
Figure 7 Market Entry Strategy in Flip Chip Market 2023-2030
Figure 8 Ecosystem Analysis in Flip Chip Market 2023
Figure 9 Average Selling Price in Flip Chip Market 2023-2030
Figure 10 Top Opportunites in Flip Chip Market 2023-2030
Figure 11 Market Life Cycle Analysis in Flip Chip Market
Figure 12 GlobalBy Packaging typeFlip Chip Market Revenue, 2023-2030 ($)
Figure 13 GlobalBy joining processFlip Chip Market Revenue, 2023-2030 ($)
Figure 14 GlobalBy bumping processFlip Chip Market Revenue, 2023-2030 ($)
Figure 15 GlobalBy ApplicationFlip Chip Market Revenue, 2023-2030 ($)
Figure 16 GlobalBy End UseFlip Chip Market Revenue, 2023-2030 ($)
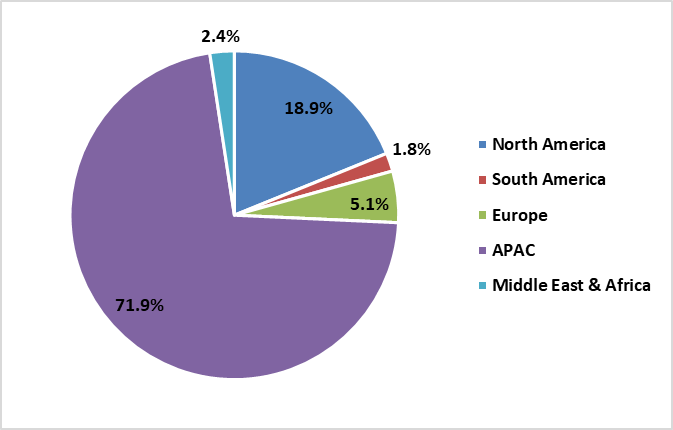
Figure 17 Global Flip Chip Market - By Geography
Figure 18 Global Flip Chip Market Value & Volume, By Geography, 2023-2030 ($)
Figure 19 Global Flip Chip Market CAGR, By Geography, 2023-2030 (%)
Figure 20 North America Flip Chip Market Value & Volume, 2023-2030 ($)
Figure 21 US Flip Chip Market Value & Volume, 2023-2030 ($)
Figure 22 US GDP and Population, 2023-2030 ($)
Figure 23 US GDP – Composition of 2023, By Sector of Origin
Figure 24 US Export and Import Value & Volume, 2023-2030 ($)
Figure 25 Canada Flip Chip Market Value & Volume, 2023-2030 ($)
Figure 26 Canada GDP and Population, 2023-2030 ($)
Figure 27 Canada GDP – Composition of 2023, By Sector of Origin
Figure 28 Canada Export and Import Value & Volume, 2023-2030 ($)
Figure 29 Mexico Flip Chip Market Value & Volume, 2023-2030 ($)
Figure 30 Mexico GDP and Population, 2023-2030 ($)
Figure 31 Mexico GDP – Composition of 2023, By Sector of Origin
Figure 32 Mexico Export and Import Value & Volume, 2023-2030 ($)
Figure 33 South America Flip Chip Market Value & Volume, 2023-2030 ($)
Figure 34 Brazil Flip Chip Market Value & Volume, 2023-2030 ($)
Figure 35 Brazil GDP and Population, 2023-2030 ($)
Figure 36 Brazil GDP – Composition of 2023, By Sector of Origin
Figure 37 Brazil Export and Import Value & Volume, 2023-2030 ($)
Figure 38 Venezuela Flip Chip Market Value & Volume, 2023-2030 ($)
Figure 39 Venezuela GDP and Population, 2023-2030 ($)
Figure 40 Venezuela GDP – Composition of 2023, By Sector of Origin
Figure 41 Venezuela Export and Import Value & Volume, 2023-2030 ($)
Figure 42 Argentina Flip Chip Market Value & Volume, 2023-2030 ($)
Figure 43 Argentina GDP and Population, 2023-2030 ($)
Figure 44 Argentina GDP – Composition of 2023, By Sector of Origin
Figure 45 Argentina Export and Import Value & Volume, 2023-2030 ($)
Figure 46 Ecuador Flip Chip Market Value & Volume, 2023-2030 ($)
Figure 47 Ecuador GDP and Population, 2023-2030 ($)
Figure 48 Ecuador GDP – Composition of 2023, By Sector of Origin
Figure 49 Ecuador Export and Import Value & Volume, 2023-2030 ($)
Figure 50 Peru Flip Chip Market Value & Volume, 2023-2030 ($)
Figure 51 Peru GDP and Population, 2023-2030 ($)
Figure 52 Peru GDP – Composition of 2023, By Sector of Origin
Figure 53 Peru Export and Import Value & Volume, 2023-2030 ($)
Figure 54 Colombia Flip Chip Market Value & Volume, 2023-2030 ($)
Figure 55 Colombia GDP and Population, 2023-2030 ($)
Figure 56 Colombia GDP – Composition of 2023, By Sector of Origin
Figure 57 Colombia Export and Import Value & Volume, 2023-2030 ($)
Figure 58 Costa Rica Flip Chip Market Value & Volume, 2023-2030 ($)
Figure 59 Costa Rica GDP and Population, 2023-2030 ($)
Figure 60 Costa Rica GDP – Composition of 2023, By Sector of Origin
Figure 61 Costa Rica Export and Import Value & Volume, 2023-2030 ($)
Figure 62 Europe Flip Chip Market Value & Volume, 2023-2030 ($)
Figure 63 U.K Flip Chip Market Value & Volume, 2023-2030 ($)
Figure 64 U.K GDP and Population, 2023-2030 ($)
Figure 65 U.K GDP – Composition of 2023, By Sector of Origin
Figure 66 U.K Export and Import Value & Volume, 2023-2030 ($)
Figure 67 Germany Flip Chip Market Value & Volume, 2023-2030 ($)
Figure 68 Germany GDP and Population, 2023-2030 ($)
Figure 69 Germany GDP – Composition of 2023, By Sector of Origin
Figure 70 Germany Export and Import Value & Volume, 2023-2030 ($)
Figure 71 Italy Flip Chip Market Value & Volume, 2023-2030 ($)
Figure 72 Italy GDP and Population, 2023-2030 ($)
Figure 73 Italy GDP – Composition of 2023, By Sector of Origin
Figure 74 Italy Export and Import Value & Volume, 2023-2030 ($)
Figure 75 France Flip Chip Market Value & Volume, 2023-2030 ($)
Figure 76 France GDP and Population, 2023-2030 ($)
Figure 77 France GDP – Composition of 2023, By Sector of Origin
Figure 78 France Export and Import Value & Volume, 2023-2030 ($)
Figure 79 Netherlands Flip Chip Market Value & Volume, 2023-2030 ($)
Figure 80 Netherlands GDP and Population, 2023-2030 ($)
Figure 81 Netherlands GDP – Composition of 2023, By Sector of Origin
Figure 82 Netherlands Export and Import Value & Volume, 2023-2030 ($)
Figure 83 Belgium Flip Chip Market Value & Volume, 2023-2030 ($)
Figure 84 Belgium GDP and Population, 2023-2030 ($)
Figure 85 Belgium GDP – Composition of 2023, By Sector of Origin
Figure 86 Belgium Export and Import Value & Volume, 2023-2030 ($)
Figure 87 Spain Flip Chip Market Value & Volume, 2023-2030 ($)
Figure 88 Spain GDP and Population, 2023-2030 ($)
Figure 89 Spain GDP – Composition of 2023, By Sector of Origin
Figure 90 Spain Export and Import Value & Volume, 2023-2030 ($)
Figure 91 Denmark Flip Chip Market Value & Volume, 2023-2030 ($)
Figure 92 Denmark GDP and Population, 2023-2030 ($)
Figure 93 Denmark GDP – Composition of 2023, By Sector of Origin
Figure 94 Denmark Export and Import Value & Volume, 2023-2030 ($)
Figure 95 APAC Flip Chip Market Value & Volume, 2023-2030 ($)
Figure 96 China Flip Chip Market Value & Volume, 2023-2030
Figure 97 China GDP and Population, 2023-2030 ($)
Figure 98 China GDP – Composition of 2023, By Sector of Origin
Figure 99 China Export and Import Value & Volume, 2023-2030 ($)Flip Chip Market China Export and Import Value & Volume, 2023-2030 ($)
Figure 100 Australia Flip Chip Market Value & Volume, 2023-2030 ($)
Figure 101 Australia GDP and Population, 2023-2030 ($)
Figure 102 Australia GDP – Composition of 2023, By Sector of Origin
Figure 103 Australia Export and Import Value & Volume, 2023-2030 ($)
Figure 104 South Korea Flip Chip Market Value & Volume, 2023-2030 ($)
Figure 105 South Korea GDP and Population, 2023-2030 ($)
Figure 106 South Korea GDP – Composition of 2023, By Sector of Origin
Figure 107 South Korea Export and Import Value & Volume, 2023-2030 ($)
Figure 108 India Flip Chip Market Value & Volume, 2023-2030 ($)
Figure 109 India GDP and Population, 2023-2030 ($)
Figure 110 India GDP – Composition of 2023, By Sector of Origin
Figure 111 India Export and Import Value & Volume, 2023-2030 ($)
Figure 112 Taiwan Flip Chip Market Value & Volume, 2023-2030 ($)
Figure 113 Taiwan GDP and Population, 2023-2030 ($)
Figure 114 Taiwan GDP – Composition of 2023, By Sector of Origin
Figure 115 Taiwan Export and Import Value & Volume, 2023-2030 ($)
Figure 116 Malaysia Flip Chip Market Value & Volume, 2023-2030 ($)
Figure 117 Malaysia GDP and Population, 2023-2030 ($)
Figure 118 Malaysia GDP – Composition of 2023, By Sector of Origin
Figure 119 Malaysia Export and Import Value & Volume, 2023-2030 ($)
Figure 120 Hong Kong Flip Chip Market Value & Volume, 2023-2030 ($)
Figure 121 Hong Kong GDP and Population, 2023-2030 ($)
Figure 122 Hong Kong GDP – Composition of 2023, By Sector of Origin
Figure 123 Hong Kong Export and Import Value & Volume, 2023-2030 ($)
Figure 124 Middle East & Africa Flip Chip Market Middle East & Africa 3D Printing Market Value & Volume, 2023-2030 ($)
Figure 125 Russia Flip Chip Market Value & Volume, 2023-2030 ($)
Figure 126 Russia GDP and Population, 2023-2030 ($)
Figure 127 Russia GDP – Composition of 2023, By Sector of Origin
Figure 128 Russia Export and Import Value & Volume, 2023-2030 ($)
Figure 129 Israel Flip Chip Market Value & Volume, 2023-2030 ($)
Figure 130 Israel GDP and Population, 2023-2030 ($)
Figure 131 Israel GDP – Composition of 2023, By Sector of Origin
Figure 132 Israel Export and Import Value & Volume, 2023-2030 ($)
Figure 133 Entropy Share, By Strategies, 2023-2030* (%)Flip Chip Market
Figure 134 Developments, 2023-2030*Flip Chip Market
Figure 135 Company 1 Flip Chip Market Net Revenue, By Years, 2023-2030* ($)
Figure 136 Company 1 Flip Chip Market Net Revenue Share, By Business segments, 2023 (%)
Figure 137 Company 1 Flip Chip Market Net Sales Share, By Geography, 2023 (%)
Figure 138 Company 2 Flip Chip Market Net Revenue, By Years, 2023-2030* ($)
Figure 139 Company 2 Flip Chip Market Net Revenue Share, By Business segments, 2023 (%)
Figure 140 Company 2 Flip Chip Market Net Sales Share, By Geography, 2023 (%)
Figure 141 Company 3Flip Chip Market Net Revenue, By Years, 2023-2030* ($)
Figure 142 Company 3Flip Chip Market Net Revenue Share, By Business segments, 2023 (%)
Figure 143 Company 3Flip Chip Market Net Sales Share, By Geography, 2023 (%)
Figure 144 Company 4 Flip Chip Market Net Revenue, By Years, 2023-2030* ($)
Figure 145 Company 4 Flip Chip Market Net Revenue Share, By Business segments, 2023 (%)
Figure 146 Company 4 Flip Chip Market Net Sales Share, By Geography, 2023 (%)
Figure 147 Company 5 Flip Chip Market Net Revenue, By Years, 2023-2030* ($)
Figure 148 Company 5 Flip Chip Market Net Revenue Share, By Business segments, 2023 (%)
Figure 149 Company 5 Flip Chip Market Net Sales Share, By Geography, 2023 (%)
Figure 150 Company 6 Flip Chip Market Net Revenue, By Years, 2023-2030* ($)
Figure 151 Company 6 Flip Chip Market Net Revenue Share, By Business segments, 2023 (%)
Figure 152 Company 6 Flip Chip Market Net Sales Share, By Geography, 2023 (%)
Figure 153 Company 7 Flip Chip Market Net Revenue, By Years, 2023-2030* ($)
Figure 154 Company 7 Flip Chip Market Net Revenue Share, By Business segments, 2023 (%)
Figure 155 Company 7 Flip Chip Market Net Sales Share, By Geography, 2023 (%)
Figure 156 Company 8 Flip Chip Market Net Revenue, By Years, 2023-2030* ($)
Figure 157 Company 8 Flip Chip Market Net Revenue Share, By Business segments, 2023 (%)
Figure 158 Company 8 Flip Chip Market Net Sales Share, By Geography, 2023 (%)
Figure 159 Company 9 Flip Chip Market Net Revenue, By Years, 2023-2030* ($)
Figure 160 Company 9 Flip Chip Market Net Revenue Share, By Business segments, 2023 (%)
Figure 161 Company 9 Flip Chip Market Net Sales Share, By Geography, 2023 (%)
Figure 162 Company 10 Flip Chip Market Net Revenue, By Years, 2023-2030* ($)
Figure 163 Company 10 Flip Chip Market Net Revenue Share, By Business segments, 2023 (%)
Figure 164 Company 10 Flip Chip Market Net Sales Share, By Geography, 2023 (%)
Figure 165 Company 11 Flip Chip Market Net Revenue, By Years, 2023-2030* ($)
Figure 166 Company 11 Flip Chip Market Net Revenue Share, By Business segments, 2023 (%)
Figure 167 Company 11 Flip Chip Market Net Sales Share, By Geography, 2023 (%)
Figure 168 Company 12 Flip Chip Market Net Revenue, By Years, 2023-2030* ($)
Figure 169 Company 12 Flip Chip Market Net Revenue Share, By Business segments, 2023 (%)
Figure 170 Company 12 Flip Chip Market Net Sales Share, By Geography, 2023 (%)
Figure 171 Company 13Flip Chip Market Net Revenue, By Years, 2023-2030* ($)
Figure 172 Company 13Flip Chip Market Net Revenue Share, By Business segments, 2023 (%)
Figure 173 Company 13Flip Chip Market Net Sales Share, By Geography, 2023 (%)
Figure 174 Company 14 Flip Chip Market Net Revenue, By Years, 2023-2030* ($)
Figure 175 Company 14 Flip Chip Market Net Revenue Share, By Business segments, 2023 (%)
Figure 176 Company 14 Flip Chip Market Net Sales Share, By Geography, 2023 (%)
Figure 177 Company 15 Flip Chip Market Net Revenue, By Years, 2023-2030* ($)
Figure 178 Company 15 Flip Chip Market Net Revenue Share, By Business segments, 2023 (%)
Figure 179 Company 15 Flip Chip Market Net Sales Share, By Geography, 2023 (%)
 Email
Email Print
Print