 Email
Email Print
Print


Defoamers Market - By Type ; By Application ; & Geographic Analysis - Forecast (2024-2030)
Defoamer Market Overview
Defoamer Market size is forecast to reach $10.13 billion by 2030 after growing at a CAGR of 4.1% during 2024-2030. Defoamer is chemical additive that reduces the formation of foam in industrial process liquids. The growth of the market of Defoamer is expected to be driven by the high demand from the food and beverages industry. A prominent trend in the Defoamer market is the increasing demand for sustainable solutions. As industries prioritize environmental consciousness, there's a growing interest in Defoamers derived from eco-friendly sources. Biodegradable and renewable Defoamers, often plant-based, are gaining traction. Manufacturers are investing in research to develop formulations that provide effective foam control while aligning with sustainability goals, catering to environmentally conscious industries like food and beverage, pharmaceuticals, and wastewater treatment. Another trend involves technological advancements for precise foam control. Industries such as manufacturing, oil and gas, and chemical processing are seeking Defoamers with improved efficiency and application precision. Innovations include the development of smart or responsive antifoaming solutions that can adapt to varying foam challenges dynamically. Nanotechnology is being explored to enhance the efficiency of Defoamers. Nano-sized particles can offer improved dispersion and coverage, leading to enhanced foam control. This trend involves the development of nanomaterial-based Defoamers with higher surface area and reactivity. The incorporation of nanotechnology also contributes to reducing the overall dosage of Defoamers required for effective foam suppression. The use of Defoamers is expanding beyond traditional industries. There is a growing demand for these agents in cosmetic and personal care product formulations where controlling foam is crucial for product stability and quality. As consumers become more discerning about the ingredients in personal care items, the market for Defoamers in this sector is experiencing growth.
Market Snapshot :

Defoamer Market Report Coverage
The report: “Defoamer Market -Forecast (2024-2030)”, by IndustryARC, covers an in-depth analysis of the following segments of Defoamer industry.
By Type: Water Based, Oil Based, Silicone Based, Alkyd Based, Polymer Based and Others
By Application: Adhesives, Coatings, Detergents, Wood Pulp, Food Processing, Wastewater Treatment and Others.
By End Use: Oil and gas, Paint and coatings, Food and Beverages, Pharmaceuticals, Textile, Pulp and Paper, Industrial and Others.
Geography: North America, South America, Europe, APAC, and RoW.
Key Takeaways
- APAC dominates the Defoamer owing to increasing demand from Oil and gas sector.
- Continues expanding application of Defoamer will drive the growth of the market in the forecast period.
- The formation of foam in industrial process liquids as it has an affinity to the air-liquid surface will hinder the growth of the market in the forecast period.
For more details on this report - Request for Sample
Defoamer Market Segment Analysis - By Type
Silicone based Defoamers held the largest share in the Defoamers market in 2023. Silicone based Defoamers have properties such as low surface tension, chemical inertness, thermal stability, and complete solubility in water. These Defoamers have heavy duty type and are suitable for neutralizing surface foam and to release the entrained air in non-aqueous foaming applications. Hence, they have been finding preferential application in crude oil refineries. Silicone based Defoamers contain less volatile organic compound due to the environmental regulation passed by the North America and Europe government. This Defoamers are high in demand as compared to other chemicals due to its optimal reactivity with process ingredients and long operation life. This factor will drive the growth of market of silicone based Defoamers in the forecast period.
Defoamer Market Segment Analysis - By Application
Food Processing held the largest share in the Defoamers market in 2023. Food grade Defoamers are used to reduce and prevent foam formation. Foam is a byproduct formed during processing of food. It is also used in the fermentation process in breweries to drain out the foam and offer optimize efficiency. The food processing industry is a mature sector that is undergoing a tumultuous phase due to rising global demands for food safety, increasing food insecurity and increasing customer demand for higher quality and sustainability. Today's food supply chain is more globalized, longer and more dynamic than ever before. With increasing imports and exports, processed foods rely on longer supply chains, which pose a major challenge to ensuring food safety.
Defoamer Market Segment Analysis - By End Use
Pharmaceuticals sector held the largest share in the Defoamers market in 2023 with a share of 7.3%. Defoamer are used for pharmaceutic fermentation in antibiotics and enzymes. Among these the growing and aging population, rising prevalence of chronic diseases are major drivers in the growth of pharmaceutical sector globally. In the United States, overall spending growth in pharmaceutical is driven by a range of factors including new product uptake and brand pricing, while it is offset by patent expiries and generics. Pharmaceutical spending in China reached $7.1 billion in 2023. These factors will drive the growth of the market of pharmaceuticals in the forecast period.
The 2019–2020 coronavirus pandemic has had far-reaching consequences beyond the spread of the disease and efforts to quarantine it. As the pandemic has spread around the globe, concerns have shifted from supply-side manufacturing issues to decreased business. The current epidemic outbreak has deeply influenced consumers' daily life and in addition to the impact on pharmaceutical sector. About 90% of the needs of antibiotic makers in globally is fulfilled by China. Raw materials from China are used in making antibiotics, paracetamol, and diabetes and cardiovascular drugs, among others are not exported. This factor will hinder the growth of market for this year. But after the situation became normal it will grow at a steady rate in the forecast period.
Defoamer Market Segment Analysis - By Geography
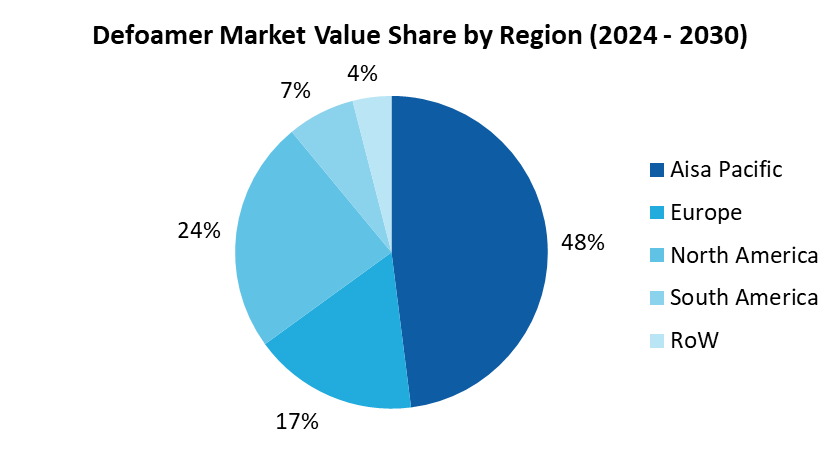
APAC dominates the Defoamers market with a share of 48% followed by North America and Europe. The economy of APAC is mainly influenced by the economic dynamics of countries such as China and India, but with growing foreign direct investment for economic development of South East Asia, the current scenario is changing. Countries in South East Asia are witnessing high growth the oil and gas sector. Defoamer are used in crude oil refinery as it helps in reducing frothy crude oil production by eliminating foam from tanks or gas scrubbers. The oil and gas sector plays a major role in influencing decision making for all the other important sections of the economy. According to the trade map the total export of light crude oil globally in the year 2023 was 102.2 mb/d. This factor will drive the growth of the market of oil and gas sector in the forecast period.
Defoamer Market Drivers
High demand of crude oil across the world will drive the growth in the forecast period
High demand of crude oil across the world is expected to drive the global Defoamer’s market growth. However, other non-renewable energy resources are not capable of fulfilling the growing demand. Oil and gas is one of the largest energy resources in the world; hence, it becomes essential to use and distribute crude oil in the productive and efficient way. This factor will drive the growth of market in the forecast period.
Rise in the Paint and coatings sector will drive the growth of market in the forecast period
The coatings industry is one of the most heavily regulated industries in the world, so producers have been forced to adopt low-solvent and solvent less technologies in the past 40 years, and will continue to do so. The number of coatings producers is large, but most are regional producers. This factor will drive the growth of market in the forecast period.
Defoamer Market Restriction
Hike in the crude prices will hamper the growth of the market in the forecast period
Tremendous hike in the crude prices and global recession will hinder the growth of the market. This was on the back of a deepening slowdown in the world economy as the outbreak of novel coronavirus has spread across the globe and a price war between major oil producing countries like Saudi Arabia, Iran and Russia. These factor will hinder the growth of the market in the forecast period.
Defoamer Market Landscape
Technology launches, acquisitions and R&D activities are key strategies adopted by players in the Defoamers market. Major players in the Defoamers market are BASF, Evonik Industries, Air Products and Chemicals, Inc., Wacker Chemie AG, DOW Corning Corporation, and Others.
Acquisitions/Technology Launches/ Product Launches
- In Oct 2023, Evonik Launches New Defoamer that Combines the Best Properties of Silicone and Bio-Based Materials. The new product is targeted at water-based ink and coating applications, uses a unique new mixing technology, contains more than 50% bio-based materials in the solid content, and complies with multiple food contact regulations.
- In May 2023, Jio-bp launches new diesel that offers saving of Rs 1.1 lakh per truck annually. It is designed to work across a range of commercial vehicles, and with ongoing use it offers a variety of benefits to drivers and fleet owners. It contains an anti-foam agent that helps deliver cleaner, faster, and safer refuelling, so trucks can spend more time on the road and less time at the pump.
For more Chemical and Materials related reports, Please click here
List of Tables
Table 1: Defoamers Market Overview 2023-2030
Table 2: Defoamers Market Leader Analysis 2023-2024 (US$)
Table 3: Defoamers Market Product Analysis 2023-2024 (US$)
Table 4: Defoamers Market End User Analysis 2023-2024 (US$)
Table 5: Defoamers Market Patent Analysis 2021-2023* (US$)
Table 6: Defoamers Market Financial Analysis 2023-2024 (US$)
Table 7: Defoamers Market Driver Analysis 2023-2024 (US$)
Table 8: Defoamers Market Challenges Analysis 2023-2024 (US$)
Table 9: Defoamers Market Constraint Analysis 2023-2024 (US$)
Table 10: Defoamers Market Supplier Bargaining Power Analysis 2023-2024 (US$)
Table 11: Defoamers Market Buyer Bargaining Power Analysis 2023-2024 (US$)
Table 12: Defoamers Market Threat of Substitutes Analysis 2023-2024 (US$)
Table 13: Defoamers Market Threat of New Entrants Analysis 2023-2024 (US$)
Table 14: Defoamers Market Degree of Competition Analysis 2023-2024 (US$)
Table 15: Defoamers Market Value Chain Analysis 2023-2024 (US$)
Table 16: Defoamers Market Pricing Analysis 2023-2030 (US$)
Table 17: Defoamers Market Opportunities Analysis 2023-2030 (US$)
Table 18: Defoamers Market Product Life Cycle Analysis 2023-2030 (US$)
Table 19: Defoamers Market Supplier Analysis 2023-2024 (US$)
Table 20: Defoamers Market Distributor Analysis 2023-2024 (US$)
Table 21: Defoamers Market Trend Analysis 2023-2024 (US$)
Table 22: Defoamers Market Size 2023 (US$)
Table 23: Defoamers Market Forecast Analysis 2023-2030 (US$)
Table 24: Defoamers Market Sales Forecast Analysis 2023-2030 (Units)
Table 25: Defoamers Market, Revenue & Volume, By Type, 2023-2030 ($)
Table 26: Defoamers Market By Type, Revenue & Volume, By Introduction, 2023-2030 ($)
Table 27: Defoamers Market By Type, Revenue & Volume, By Silicone Defoamers, 2023-2030 ($)
Table 28: Defoamers Market By Type, Revenue & Volume, By Non-Silicone Defoamers, 2023-2030 ($)
Table 29: Defoamers Market By Type, Revenue & Volume, By Mineral Oil Defoamers, 2023-2030 ($)
Table 30: Defoamers Market By Type, Revenue & Volume, By Powder Defoamers, 2023-2030 ($)
Table 31: Defoamers Market, Revenue & Volume, By Application, 2023-2030 ($)
Table 32: Defoamers Market By Application, Revenue & Volume, By Introduction, 2023-2030 ($)
Table 33: Defoamers Market By Application, Revenue & Volume, By Pulp and Paper, 2023-2030 ($)
Table 34: Defoamers Market By Application, Revenue & Volume, By Paints and Coatings, 2023-2030 ($)
Table 35: Defoamers Market By Application, Revenue & Volume, By Food and Beverage Industry, 2023-2030 ($)
Table 36: Defoamers Market By Application, Revenue & Volume, By Oil and Gas, 2023-2030 ($)
Table 37: North America Defoamers Market, Revenue & Volume, By Type, 2023-2030 ($)
Table 38: North America Defoamers Market, Revenue & Volume, By Application, 2023-2030 ($)
Table 39: South america Defoamers Market, Revenue & Volume, By Type, 2023-2030 ($)
Table 40: South america Defoamers Market, Revenue & Volume, By Application, 2023-2030 ($)
Table 41: Europe Defoamers Market, Revenue & Volume, By Type, 2023-2030 ($)
Table 42: Europe Defoamers Market, Revenue & Volume, By Application, 2023-2030 ($)
Table 43: APAC Defoamers Market, Revenue & Volume, By Type, 2023-2030 ($)
Table 44: APAC Defoamers Market, Revenue & Volume, By Application, 2023-2030 ($)
Table 45: Middle East & Africa Defoamers Market, Revenue & Volume, By Type, 2023-2030 ($)
Table 46: Middle East & Africa Defoamers Market, Revenue & Volume, By Application, 2023-2030 ($)
Table 47: Russia Defoamers Market, Revenue & Volume, By Type, 2023-2030 ($)
Table 48: Russia Defoamers Market, Revenue & Volume, By Application, 2023-2030 ($)
Table 49: Israel Defoamers Market, Revenue & Volume, By Type, 2023-2030 ($)
Table 50: Israel Defoamers Market, Revenue & Volume, By Application, 2023-2030 ($)
Table 51: Top Companies 2023 (US$)Defoamers Market, Revenue & Volume
Table 52: Product Launch 2023-2024Defoamers Market, Revenue & Volume
Table 53: Mergers & Acquistions 2023-2024Defoamers Market, Revenue & Volume
List of Figures
Figure 1: Overview of Defoamers Market 2023-2030
Figure 2: Market Share Analysis for Defoamers Market 2023 (US$)
Figure 3: Product Comparison in Defoamers Market 2023-2024 (US$)
Figure 4: End User Profile for Defoamers Market 2023-2024 (US$)
Figure 5: Patent Application and Grant in Defoamers Market 2021-2023* (US$)
Figure 6: Top 5 Companies Financial Analysis in Defoamers Market 2023-2024 (US$)
Figure 7: Market Entry Strategy in Defoamers Market 2023-2024
Figure 8: Ecosystem Analysis in Defoamers Market 2023
Figure 9: Average Selling Price in Defoamers Market 2023-2030
Figure 10: Top Opportunites in Defoamers Market 2023-2024
Figure 11: Market Life Cycle Analysis in Defoamers Market
Figure 12: GlobalBy TypeDefoamers Market Revenue, 2023-2030 ($)
Figure 13: GlobalBy ApplicationDefoamers Market Revenue, 2023-2030 ($)
Figure 14: Global Defoamers Market - By Geography
Figure 15: Global Defoamers Market Value & Volume, By Geography, 2023-2030 ($)
Figure 16: Global Defoamers Market CAGR, By Geography, 2023-2030 (%)
Figure 17: North America Defoamers Market Value & Volume, 2023-2030 ($)
Figure 18: US Defoamers Market Value & Volume, 2023-2030 ($)
Figure 19: US GDP and Population, 2023-2024 ($)
Figure 20: US GDP – Composition of 2023, By Sector of Origin
Figure 21: US Export and Import Value & Volume, 2023-2024 ($)
Figure 22: Canada Defoamers Market Value & Volume, 2023-2030 ($)
Figure 23: Canada GDP and Population, 2023-2024 ($)
Figure 24: Canada GDP – Composition of 2023, By Sector of Origin
Figure 25: Canada Export and Import Value & Volume, 2023-2024 ($)
Figure 26: Mexico Defoamers Market Value & Volume, 2023-2030 ($)
Figure 27: Mexico GDP and Population, 2023-2024 ($)
Figure 28: Mexico GDP – Composition of 2023, By Sector of Origin
Figure 29: Mexico Export and Import Value & Volume, 2023-2024 ($)
Figure 30: South America Defoamers Market Value & Volume, 2023-2030 ($)
Figure 31: Brazil Defoamers Market Value & Volume, 2023-2030 ($)
Figure 32: Brazil GDP and Population, 2023-2024 ($)
Figure 33: Brazil GDP – Composition of 2023, By Sector of Origin
Figure 34: Brazil Export and Import Value & Volume, 2023-2024 ($)
Figure 35: Venezuela Defoamers Market Value & Volume, 2023-2030 ($)
Figure 36: Venezuela GDP and Population, 2023-2024 ($)
Figure 37: Venezuela GDP – Composition of 2023, By Sector of Origin
Figure 38: Venezuela Export and Import Value & Volume, 2023-2024 ($)
Figure 39: Argentina Defoamers Market Value & Volume, 2023-2030 ($)
Figure 40: Argentina GDP and Population, 2023-2024 ($)
Figure 41: Argentina GDP – Composition of 2023, By Sector of Origin
Figure 42: Argentina Export and Import Value & Volume, 2023-2024 ($)
Figure 43: Ecuador Defoamers Market Value & Volume, 2023-2030 ($)
Figure 44: Ecuador GDP and Population, 2023-2024 ($)
Figure 45: Ecuador GDP – Composition of 2023, By Sector of Origin
Figure 46: Ecuador Export and Import Value & Volume, 2023-2024 ($)
Figure 47: Peru Defoamers Market Value & Volume, 2023-2030 ($)
Figure 48: Peru GDP and Population, 2023-2024 ($)
Figure 49: Peru GDP – Composition of 2023, By Sector of Origin
Figure 50: Peru Export and Import Value & Volume, 2023-2024 ($)
Figure 51: Colombia Defoamers Market Value & Volume, 2023-2030 ($)
Figure 52: Colombia GDP and Population, 2023-2024 ($)
Figure 53: Colombia GDP – Composition of 2023, By Sector of Origin
Figure 54: Colombia Export and Import Value & Volume, 2023-2024 ($)
Figure 55: Costa Rica Defoamers Market Value & Volume, 2023-2030 ($)
Figure 56: Costa Rica GDP and Population, 2023-2024 ($)
Figure 57: Costa Rica GDP – Composition of 2023, By Sector of Origin
Figure 58: Costa Rica Export and Import Value & Volume, 2023-2024 ($)
Figure 59: Europe Defoamers Market Value & Volume, 2023-2030 ($)
Figure 60: U.K Defoamers Market Value & Volume, 2023-2030 ($)
Figure 61: U.K GDP and Population, 2023-2024 ($)
Figure 62: U.K GDP – Composition of 2023, By Sector of Origin
Figure 63: U.K Export and Import Value & Volume, 2023-2024 ($)
Figure 64: Germany Defoamers Market Value & Volume, 2023-2030 ($)
Figure 65: Germany GDP and Population, 2023-2024 ($)
Figure 66: Germany GDP – Composition of 2023, By Sector of Origin
Figure 67: Germany Export and Import Value & Volume, 2023-2024 ($)
Figure 68: Italy Defoamers Market Value & Volume, 2023-2030 ($)
Figure 69: Italy GDP and Population, 2023-2024 ($)
Figure 70: Italy GDP – Composition of 2023, By Sector of Origin
Figure 71: Italy Export and Import Value & Volume, 2023-2024 ($)
Figure 72: France Defoamers Market Value & Volume, 2023-2030 ($)
Figure 73: France GDP and Population, 2023-2024 ($)
Figure 74: France GDP – Composition of 2023, By Sector of Origin
Figure 75: France Export and Import Value & Volume, 2023-2024 ($)
Figure 76: Netherlands Defoamers Market Value & Volume, 2023-2030 ($)
Figure 77: Netherlands GDP and Population, 2023-2024 ($)
Figure 78: Netherlands GDP – Composition of 2023, By Sector of Origin
Figure 79: Netherlands Export and Import Value & Volume, 2023-2024 ($)
Figure 80: Belgium Defoamers Market Value & Volume, 2023-2030 ($)
Figure 81: Belgium GDP and Population, 2023-2024 ($)
Figure 82: Belgium GDP – Composition of 2023, By Sector of Origin
Figure 83: Belgium Export and Import Value & Volume, 2023-2024 ($)
Figure 84: Spain Defoamers Market Value & Volume, 2023-2030 ($)
Figure 85: Spain GDP and Population, 2023-2024 ($)
Figure 86: Spain GDP – Composition of 2023, By Sector of Origin
Figure 87: Spain Export and Import Value & Volume, 2023-2024 ($)
Figure 88: Denmark Defoamers Market Value & Volume, 2023-2030 ($)
Figure 89: Denmark GDP and Population, 2023-2024 ($)
Figure 90: Denmark GDP – Composition of 2023, By Sector of Origin
Figure 91: Denmark Export and Import Value & Volume, 2023-2024 ($)
Figure 92: APAC Defoamers Market Value & Volume, 2023-2030 ($)
Figure 93: China Defoamers Market Value & Volume, 2023-2030
Figure 94: China GDP and Population, 2023-2024 ($)
Figure 95: China GDP – Composition of 2023, By Sector of Origin
Figure 96: China Export and Import Value & Volume, 2023-2024 ($)Defoamers Market China Export and Import Value & Volume, 2023-2024 ($)
Figure 97: Australia Defoamers Market Value & Volume, 2023-2030 ($)
Figure 98: Australia GDP and Population, 2023-2024 ($)
Figure 99: Australia GDP – Composition of 2023, By Sector of Origin
Figure 100: Australia Export and Import Value & Volume, 2023-2024 ($)
Figure 101: South Korea Defoamers Market Value & Volume, 2023-2030 ($)
Figure 102: South Korea GDP and Population, 2023-2024 ($)
Figure 103: South Korea GDP – Composition of 2023, By Sector of Origin
Figure 104: South Korea Export and Import Value & Volume, 2023-2024 ($)
Figure 105: India Defoamers Market Value & Volume, 2023-2030 ($)
Figure 106: India GDP and Population, 2023-2024 ($)
Figure 107: India GDP – Composition of 2023, By Sector of Origin
Figure 108: India Export and Import Value & Volume, 2023-2024 ($)
Figure 109: Taiwan Defoamers Market Value & Volume, 2023-2030 ($)
Figure 110: Taiwan GDP and Population, 2023-2024 ($)
Figure 111: Taiwan GDP – Composition of 2023, By Sector of Origin
Figure 112: Taiwan Export and Import Value & Volume, 2023-2024 ($)
Figure 113: Malaysia Defoamers Market Value & Volume, 2023-2030 ($)
Figure 114: Malaysia GDP and Population, 2023-2024 ($)
Figure 115: Malaysia GDP – Composition of 2023, By Sector of Origin
Figure 116: Malaysia Export and Import Value & Volume, 2023-2024 ($)
Figure 117: Hong Kong Defoamers Market Value & Volume, 2023-2030 ($)
Figure 118: Hong Kong GDP and Population, 2023-2024 ($)
Figure 119: Hong Kong GDP – Composition of 2023, By Sector of Origin
Figure 120: Hong Kong Export and Import Value & Volume, 2023-2024 ($)
Figure 121: Middle East & Africa Defoamers Market Middle East & Africa 3D Printing Market Value & Volume, 2023-2030 ($)
Figure 122: Russia Defoamers Market Value & Volume, 2023-2030 ($)
Figure 123: Russia GDP and Population, 2023-2024 ($)
Figure 124: Russia GDP – Composition of 2023, By Sector of Origin
Figure 125: Russia Export and Import Value & Volume, 2023-2024 ($)
Figure 126: Israel Defoamers Market Value & Volume, 2023-2030 ($)
Figure 127: Israel GDP and Population, 2023-2024 ($)
Figure 128: Israel GDP – Composition of 2023, By Sector of Origin
Figure 129: Israel Export and Import Value & Volume, 2023-2024 ($)
Figure 130: Entropy Share, By Strategies, 2023-2024* (%)Defoamers Market
Figure 131: Developments, 2023-2024*Defoamers Market
Figure 132: Company 1 Defoamers Market Net Revenue, By Years, 2023-2024* ($)
Figure 133: Company 1 Defoamers Market Net Revenue Share, By Business segments, 2023 (%)
Figure 134: Company 1 Defoamers Market Net Sales Share, By Geography, 2023 (%)
Figure 135: Company 2 Defoamers Market Net Revenue, By Years, 2023-2024* ($)
Figure 136: Company 2 Defoamers Market Net Revenue Share, By Business segments, 2023 (%)
Figure 137: Company 2 Defoamers Market Net Sales Share, By Geography, 2023 (%)
Figure 138: Company 3 Defoamers Market Net Revenue, By Years, 2023-2024* ($)
Figure 139: Company 3 Defoamers Market Net Revenue Share, By Business segments, 2023 (%)
Figure 140: Company 3 Defoamers Market Net Sales Share, By Geography, 2023 (%)
Figure 141: Company 4 Defoamers Market Net Revenue, By Years, 2023-2024* ($)
Figure 142: Company 4 Defoamers Market Net Revenue Share, By Business segments, 2023 (%)
Figure 143: Company 4 Defoamers Market Net Sales Share, By Geography, 2023 (%)
Figure 144: Company 5 Defoamers Market Net Revenue, By Years, 2023-2024* ($)
Figure 145: Company 5 Defoamers Market Net Revenue Share, By Business segments, 2023 (%)
Figure 146: Company 5 Defoamers Market Net Sales Share, By Geography, 2023 (%)
Figure 147: Company 6 Defoamers Market Net Revenue, By Years, 2023-2024* ($)
Figure 148: Company 6 Defoamers Market Net Revenue Share, By Business segments, 2023 (%)
Figure 149: Company 6 Defoamers Market Net Sales Share, By Geography, 2023 (%)
Figure 150: Company 7 Defoamers Market Net Revenue, By Years, 2023-2024* ($)
Figure 151: Company 7 Defoamers Market Net Revenue Share, By Business segments, 2023 (%)
Figure 152: Company 7 Defoamers Market Net Sales Share, By Geography, 2023 (%)
Figure 153: Company 8 Defoamers Market Net Revenue, By Years, 2023-2024* ($)
Figure 154: Company 8 Defoamers Market Net Revenue Share, By Business segments, 2023 (%)
Figure 155: Company 8 Defoamers Market Net Sales Share, By Geography, 2023 (%)
Figure 156: Company 9 Defoamers Market Net Revenue, By Years, 2023-2024* ($)
Figure 157: Company 9 Defoamers Market Net Revenue Share, By Business segments, 2023 (%)
Figure 158: Company 9 Defoamers Market Net Sales Share, By Geography, 2023 (%)
Figure 159: Company 10 Defoamers Market Net Revenue, By Years, 2023-2024* ($)
Figure 160: Company 10 Defoamers Market Net Revenue Share, By Business segments, 2023 (%)
Figure 161: Company 10 Defoamers Market Net Sales Share, By Geography, 2023 (%)
Figure 162: Company 11 Defoamers Market Net Revenue, By Years, 2023-2024* ($)
Figure 163: Company 11 Defoamers Market Net Revenue Share, By Business segments, 2023 (%)
Figure 164: Company 11 Defoamers Market Net Sales Share, By Geography, 2023 (%)
Figure 165: Company 12 Defoamers Market Net Revenue, By Years, 2023-2024* ($)
Figure 166: Company 12 Defoamers Market Net Revenue Share, By Business segments, 2023 (%)
Figure 167: Company 12 Defoamers Market Net Sales Share, By Geography, 2023 (%)
Figure 168: Company 13 Defoamers Market Net Revenue, By Years, 2023-2024* ($)
Figure 169: Company 13 Defoamers Market Net Revenue Share, By Business segments, 2023 (%)
Figure 170: Company 13 Defoamers Market Net Sales Share, By Geography, 2023 (%)
Figure 171: Company 14 Defoamers Market Net Revenue, By Years, 2023-2024* ($)
Figure 172: Company 14 Defoamers Market Net Revenue Share, By Business segments, 2023 (%)
Figure 173: Company 14 Defoamers Market Net Sales Share, By Geography, 2023 (%)
Figure 174: Company 15 Defoamers Market Net Revenue, By Years, 2023-2024* ($)
Figure 175: Company 15 Defoamers Market Net Revenue Share, By Business segments, 2023 (%)
Figure 176: Company 15 Defoamers Market Net Sales Share, By Geography, 2023 (%)